Colorado's forests are changing faster than the data about them.
Earth Steward is an AI-assisted, progressive stewardship app. It pulls parcel, habitat, infestation, fuels and funding data from many sources into one current picture, so landowners, foresters and Technical Service Providers can act on the same map.
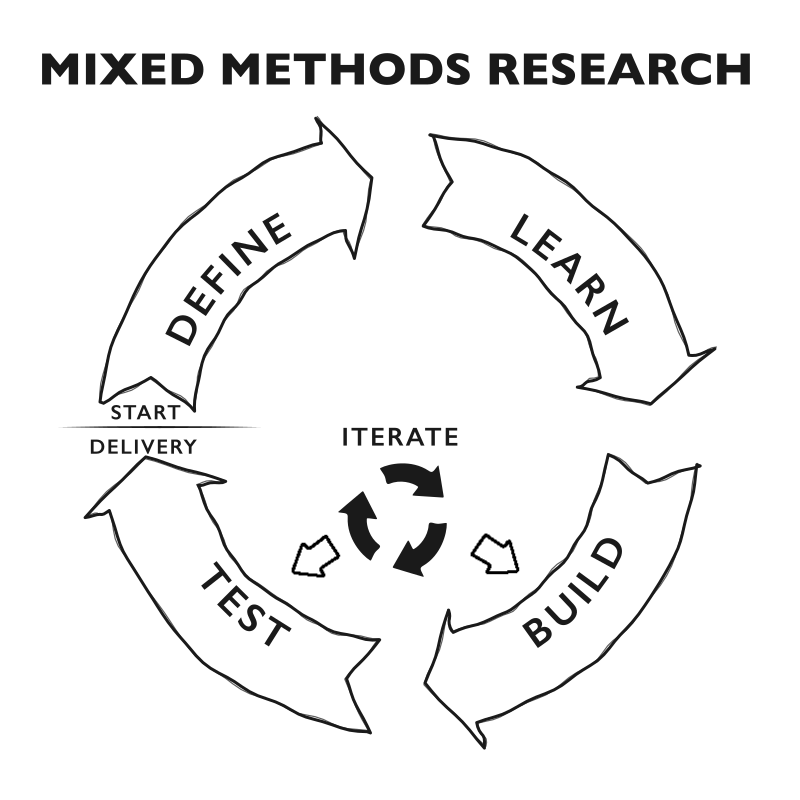
Mixed Methods Research
The project runs in four stages: Define, Learn, Build and Test, with Build and Test repeating until the product holds up. Qualitative work (interviews, personas) runs alongside quantitative work (a survey, GIS and public data), and each informs the other.
Version 1 of Earth Steward was built with the AI design process from MIT xPRO. Version 2 is the first build to run through the full Mixed Methods cycle, with V1 treated as research in Learn. This case study follows the same order. Each section shows what was decided at that stage and what evidence it rests on. Every prototype piece is labeled working, feasible or concept.
Define
The problem, the flow, who it's for, and the hypothesis to test.
The problem
The information landowners and foresters both need, from parcel boundaries and habitat to infestation, fuels and funding programs, lives across many agency websites and is split between university, state and federal sources. Keeping it current is hard: aerial surveys take time to reflect what a forester finds on the ground.
Infestations and wildfire cross property lines, but funding programs are built around individual parcels. A small parcel can be ineligible on its own while hundreds of surrounding acres face the same threat. With record drought, active budworm and beetle infestations, and shrinking federal support, quicker and more accurate data could help landowners understand their land, act with their neighbors and get a plan approved.
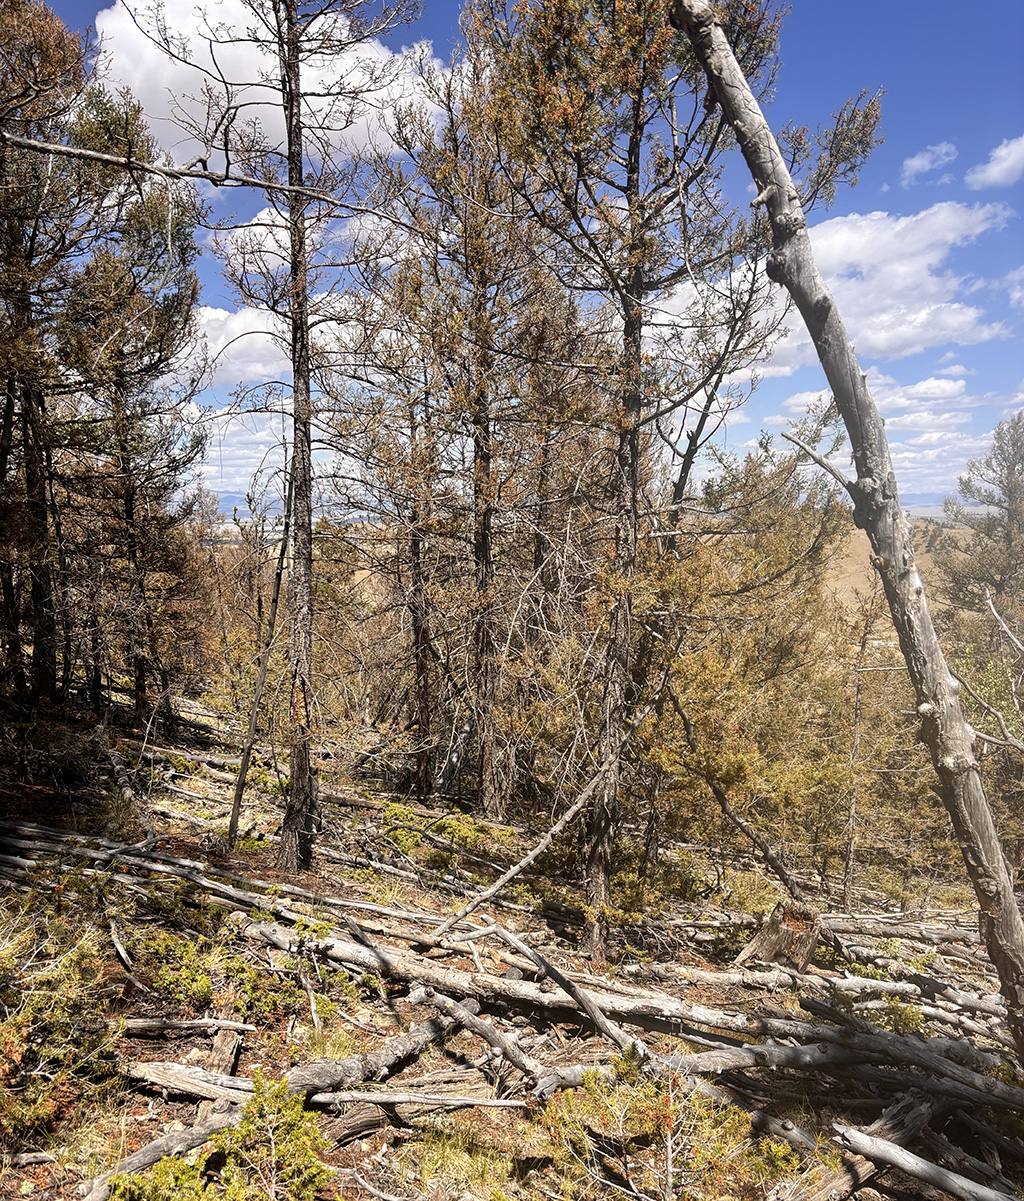
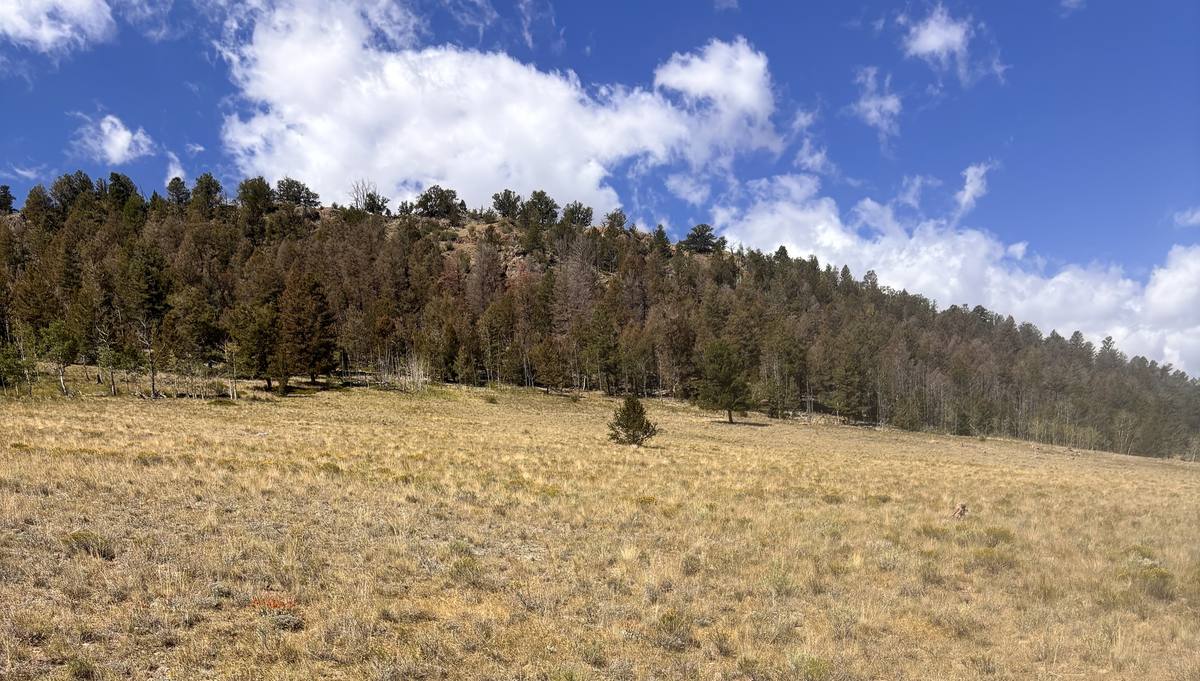
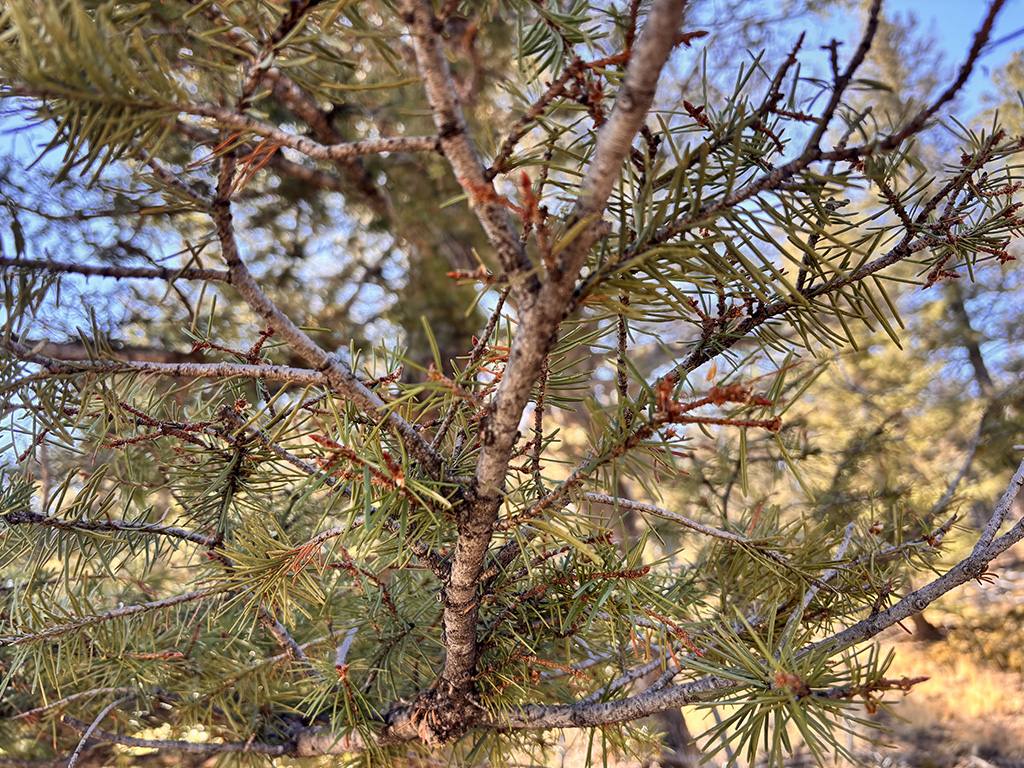
Hartsel, Park County. Field photos by Joel Heaton (reused from v1).
The flow
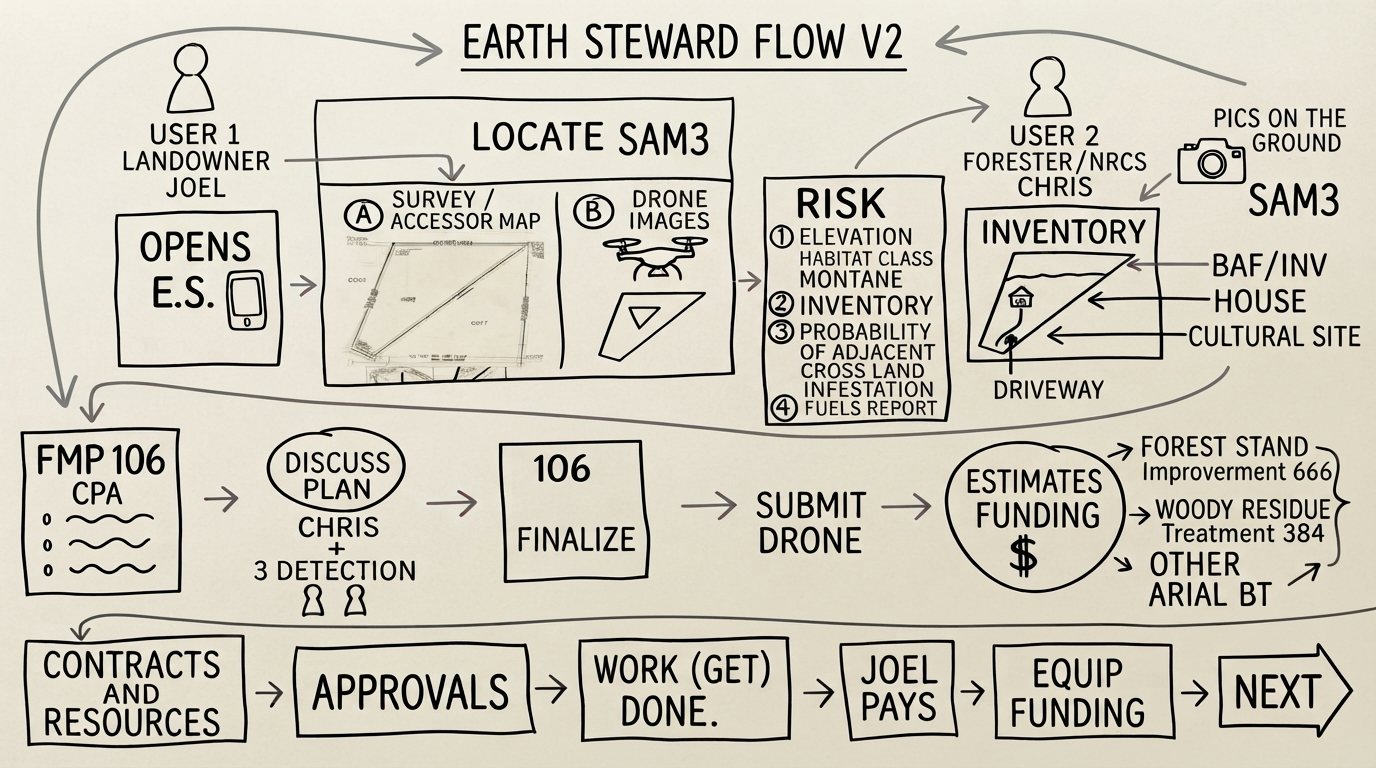
Earth Steward's flow comes from six years of studying field operations in oil and gas and in telecom fiber infrastructure. A field operator locates an asset, defines the impact, adds details and submits it to escalate. A landowner and a forester do the same work, on the ground and in geospatial terms. Only the context, assets, hierarchy and remediation change.
| Step | Field operations | Earth Steward |
|---|---|---|
| Locate | Find the asset: well, line, fiber run | Find the parcel and its neighbors |
| Impact | Define the damage or outage | Define the threat: infestation, habitat, fuels |
| Details | Notes, photos, readings | Ground photos, inventory, SAM 3 detections |
| Submit | Escalate to a supervisor or maintenance | Escalate to the forester, then the plan and funding |
Who it's for
Landowners, foresters and TSPs (Technical Service Providers).
The narrative
A one-stop shop for analysis: fuels, EPA and crowdsourced data, with parcels stitched together, even small ones. Every place has land practices or concerns worth calling out, and Earth Steward pairs what people want with where they are: constraints, concerns, solutions and an interconnected source of truth. The product grows in value with more users and more content, through network externalities.1
The pilot
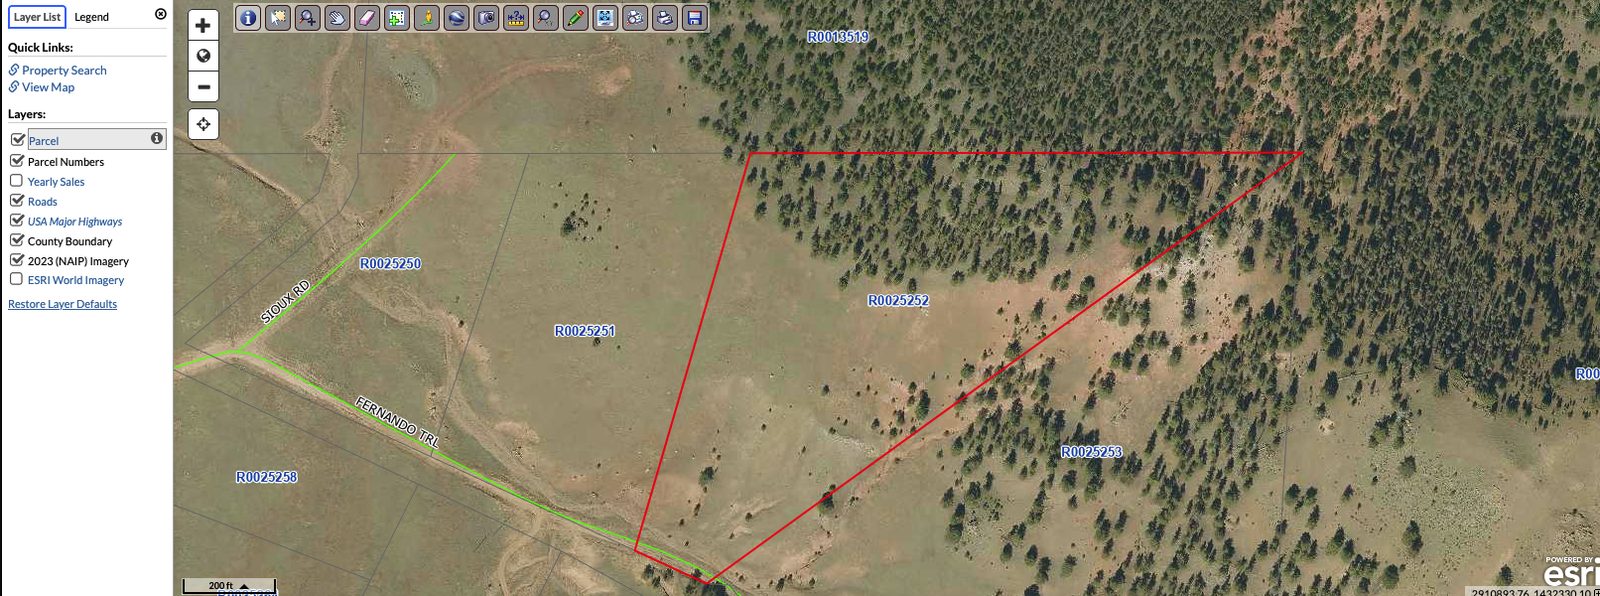
For the pilot I chose my own parcel in Hartsel, Colorado. It's accessible, it has documented infestation concerns, and it needs a land stewardship plan to reach available funding, which makes it a realistic starting point.
I used Park County assessor data for the parcel and its boundary, and CSFS documentation to understand the real threats nearby, including Western Spruce Budworm and pine beetle. From there I built a working React prototype around the parcel as the pilot and testing environment.
Where AI fits
AI shortens the time between what's happening on the land and what landowners and foresters can see. It assists each step of the flow, and people make every decision.
| Step | AI subset | What it does |
|---|---|---|
| Locate | Computer vision | Segments the parcel and canopy from aerial or drone imagery |
| Impact | Machine learning | Classifies the habitat zone and flags stressed or infested trees |
| Details | Computer vision | Identifies trees, species and damage in ground photos |
| Submit | Human in the loop | Confidence scores and alerts guide the forester's review and sign-off |
Strategic role of AI (Delta Model)3
Best product
The most complete picture of a parcel once it's located, with mapping, habitat, remediation and funding paperwork in one place.
Full customer solution
Ties private and public land together, joining the best available data into one consistent, current source of truth.
Hypothesis, How might we?
How might we give Colorado's private landowners one place to research, apply for, document, carry out and fund forest stewardship? As stewardship creates records on private land, those records can connect with neighbors' projects and with state, national forest and BLM land, linking water, soil, wildlife corridors, infestation data and farmland into one living map of the landscape. Joel Heaton
How results will be measured
Parcel submissions first, then plans submitted and approved, grant applications, acres enrolled, connected neighboring parcels, and time saved per landowner.
Learn
Foundations, document reviews, the survey and interviews, personas, and the data sources behind the product.
Foundations
What I brought into the research. I took MIT xPRO's course to apply AI to something I'm passionate about, and to use Earth Steward as a case study for continuing my career in conservation, GIS, AI and operations.
| Experience | Detail |
|---|---|
| AI product design | MIT xPRO, Designing and Building AI Products and Services (March–May 2026). Earth Steward was my capstone. Earned the certificate and three Exemplary Assignment badges. View credentials |
| Design and creative direction | 30 years in web and communication technology, animation and creative direction. UI/UX Design Transitions Certificate, Boulder Digital Arts (2014). |
| Field operations | 6+ years studying field operations: regulated tracking and energy compliance in oil and gas, and cable and fiber infrastructure in telecom. |
| Land stewardship | Secured USDA/NRCS and Massachusetts DCR landowner-incentive funding for wetland enhancement. Now researching land and forest management in Colorado with the Colorado State Forest Service and USDA/NRCS foresters. |
| NRCS Technical Service Provider | Certification in progress, toward writing Forest Management Plans. |
| Backcountry | Active in Colorado's backcountry: OHV, ATV and Jeep trails, MVUM navigation, backcountry skiing. |
| GIS | Esri ArcGIS training in progress: selecting courses with Esri, with support through Colorado's workforce program. |
Document and tech reviews
MIT xPRO workbooks: the four-stage AI design process (Module 1), a GAN-based driveway study on the pilot parcel (Module 8), and the capstone with its double diamond (Module 9).
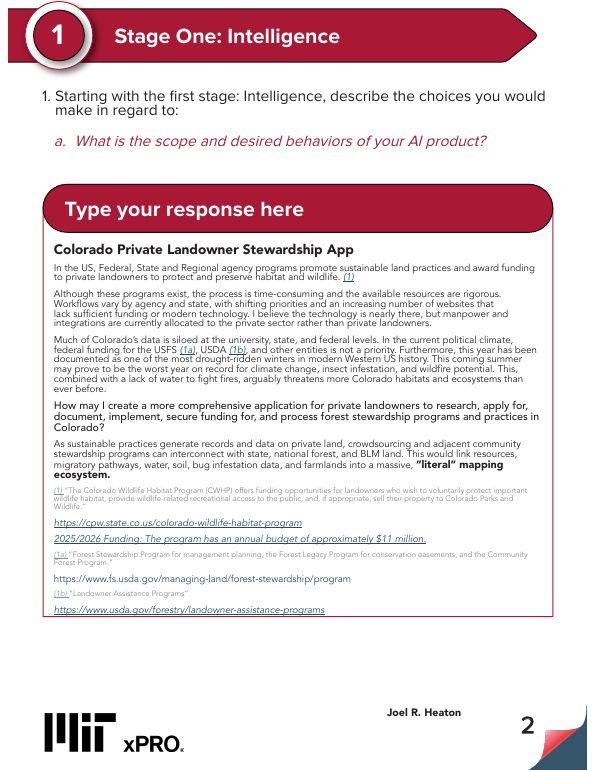
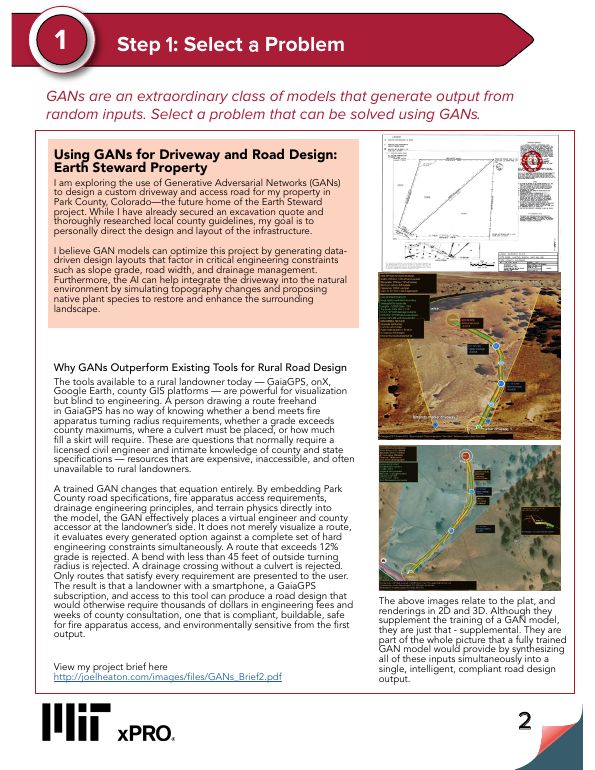
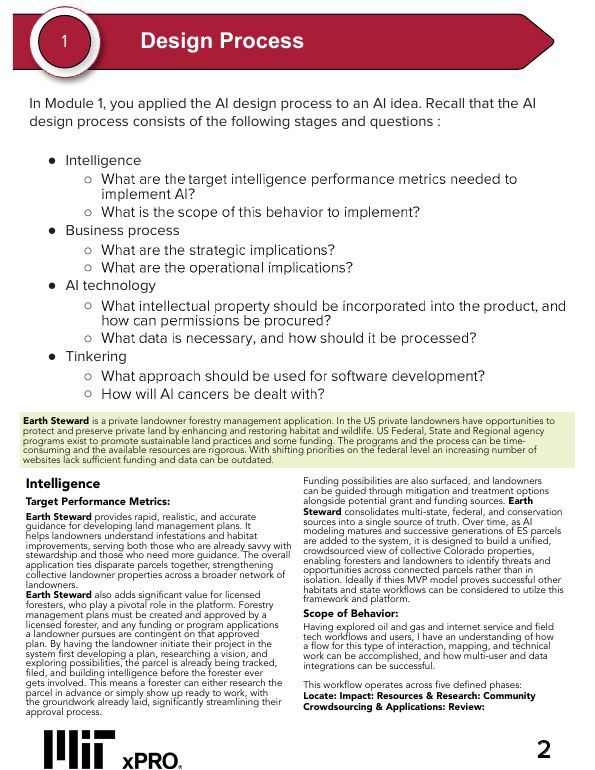
V1: what the first build taught
Version 1 was my MIT xPRO capstone, built with the AI design process rather than this Mixed Methods cycle, so here it counts as research: something built, studied and learned from. It included the first case study, a Figma design library based on Shadcn UI, the ES V1 Mobile 1.0 Figma prototypes, a React prototype and an HTML desktop parcel map.
What it proved
Habitat zone classification works: the desktop map placed the pilot parcel in the Montane zone with its typical species and threats. The Locate, Impact and Detect flow holds together on a phone-sized screen, and SAM 3 detection is feasible for canopy and ground photos.
Where it fell short
The React prototype was a mobile-like view on desktop, not a real mobile app. Detection results were illustrative, with no trained model behind them. The design library and prototypes were built before this research, so they don't yet reflect the survey, interviews or FMP work.
What people said
People who viewed V1 valued:
- Understanding anomaly detection.
- Progressive disclosure: information revealed step by step, not all at once.
- Seeing their parcel detected, with its boundary and habitat zone, and what trees to expect there.
- The help the app provides along the way.
- Being told about nearby infestations and the likelihood their trees are affected.
- Resources, treatments and agencies in one place.
- Being guided through applying for funding.
Foresters raised one concern: landowners might treat the app's output as final, make a plan and submit it without confirmation. That's a key finding. A forester in the loop is essential, so V2 has to make the forester's review a required step, not an optional one.
Those gaps set the scope for V2: a reworked design library, new Figma prototypes and a React app that is truly mobile, tested on iPhone.
Survey
A five-minute survey sent to landowners, foresters, TSPs and conservationists about technology in conservation and forest management planning.
Questions
Needed Survey questions to add.
Synthesis
First response in: a forester, anonymous. Synthesis starts at five or more responses, for a cross section, and collection continues after that.
Interviews
An initial round, each bringing a different lens: woodland ownership, wildlife management, watershed and fire science, and consulting forestry.
- Founder, national woodland owners associationFormer U.S. Forest Service forester. Took the part of a landowner. At first taken aback by AI, then saw value in using data wisely; his hesitation is the tech side, a useful signal for designing for older landowners.
- Retired federal wildlife chiefUSGS and USFWS Northeast. Wrote in with what he saw as positive about Earth Steward.
- State watershed scientistBackground in forestry and fire research in the Northern Rockies. Surprised how closely his work overlaps with Earth Steward.
- Massachusetts consulting foresterIntroduced Gaia AI's backpack LiDAR system, which maps terrain as the forester walks and takes observations by voice. Notes to come.
Questions
Needed Interview questions to add.
Synthesis
Needed Interview synthesis to come.
User flow
Flow V2 builds on the hypothesis and on years of studying field operations. The landowner opens Earth Steward and locates the parcel from the survey or assessor map, or from drone images, with SAM 3 working on whichever comes in. Risk is read from elevation and habitat class, inventory, the probability of cross-boundary infestation, and fuels. The forester adds the ground inventory, then the plan moves through the FMP 106, funding, contracts, approvals and the work itself.
Personas
First drafts, to be refined with survey results.
Joel and Kristen
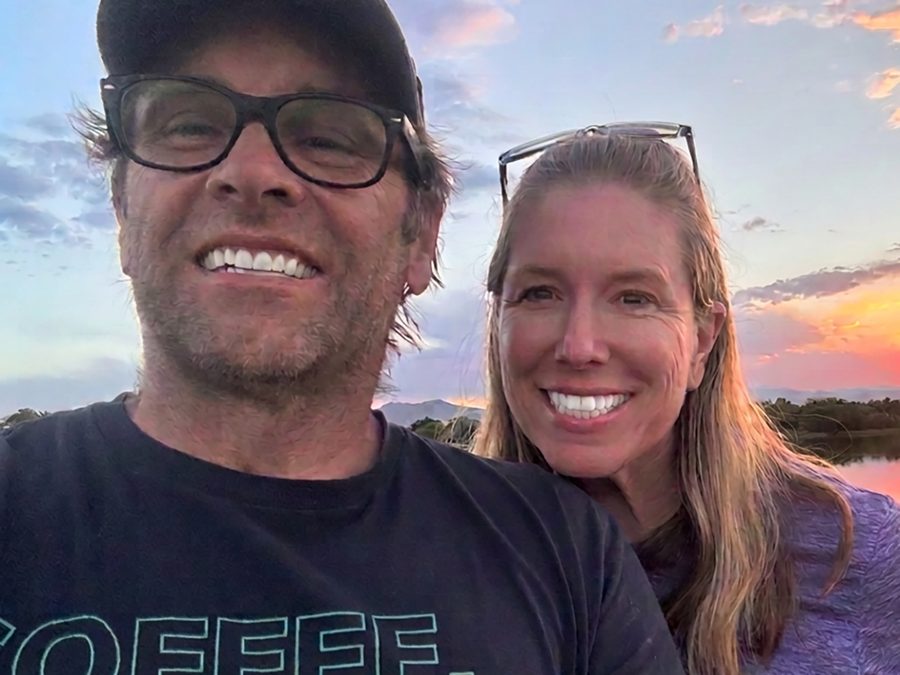
About 12 acres in Park County, bought as an investment and a place to enjoy. Active infestation on and around the land. They camp there now and will build a small second home someday.
- Goals
- See what's on the land, learn its species, improve its health and value, reduce fire risk, apply for funding, and understand how the parcel connects to nearby BLM land and wildlife.
- Frustrations
- Information spread across a dozen agency sites, aerial maps that lag what they see, only some weekends on the land, and a parcel too small to qualify alone.
- Earth Steward helps by
- Turning a weekend visit into a documented parcel, a habitat zone and a path to a forester and funding, with the parcel shown in context.
"We want to take care of this land and understand how it connects to everything around it, but we don't know where to start or who to ask."
Chris
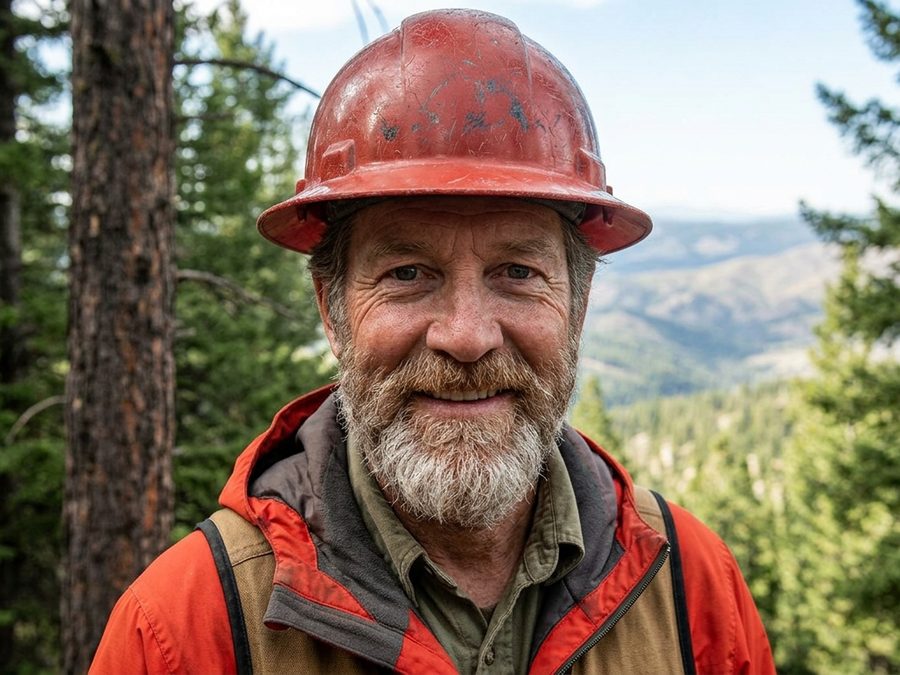
Grew up on a ranch, earned a forestry degree from Purdue, and moved to Colorado 25 years ago. Knowledgeable, thorough and empathetic; licensed in NRCS practices.
- Goals
- Help as many landowners as he can, write sound plans, and get treatments funded and done.
- Frustrations
- More landowners than site visits, landowners who arrive with little information, aerial data that lags his findings, and paperwork that takes time from the woods.
- Earth Steward helps by
- Handing him a parcel that's already located, classified and photographed, ready for his ground inventory and sign-off.
"If they came to me knowing what's on their land, I could spend my time solving problems instead of finding them."
Jebbo
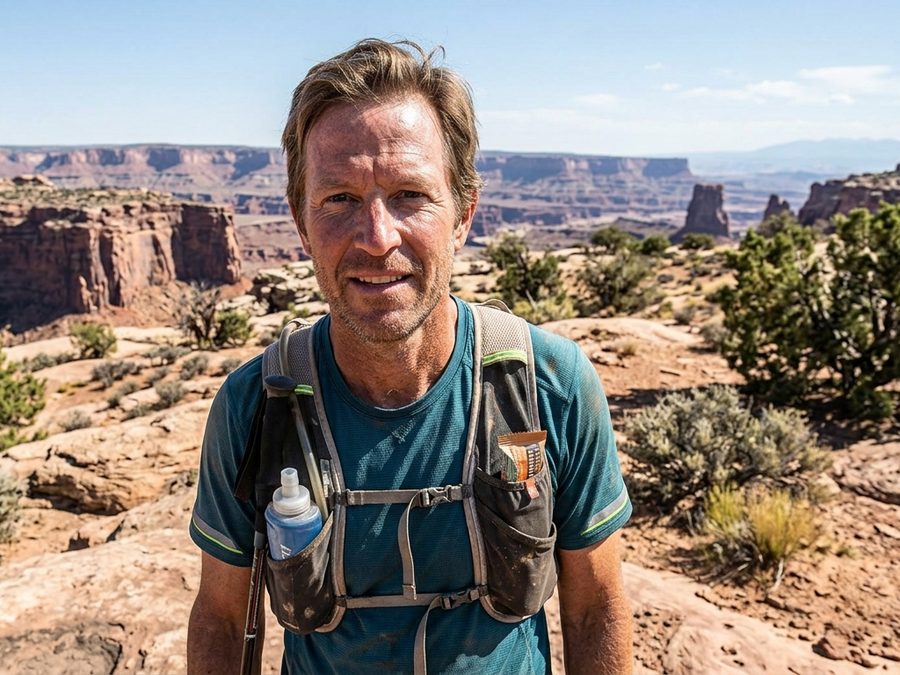
Ten years in Colorado, a marketing background, and a love of skiing, biking, hiking and kayaking. Became a TSP to earn a living writing FMPs and to spend more time outside.
- Goals
- Build a steady client base, write FMPs efficiently and correctly, and work outdoors.
- Frustrations
- Newer to forestry than the foresters around him, so he leans on good data and clear formats. Finding clients takes time.
- Earth Steward helps by
- Bringing him landowners ready for a plan, with inventory data already structured for the FMP.
"I want to help landowners and be in the field, not chase data across ten websites."
Forest Management Plans
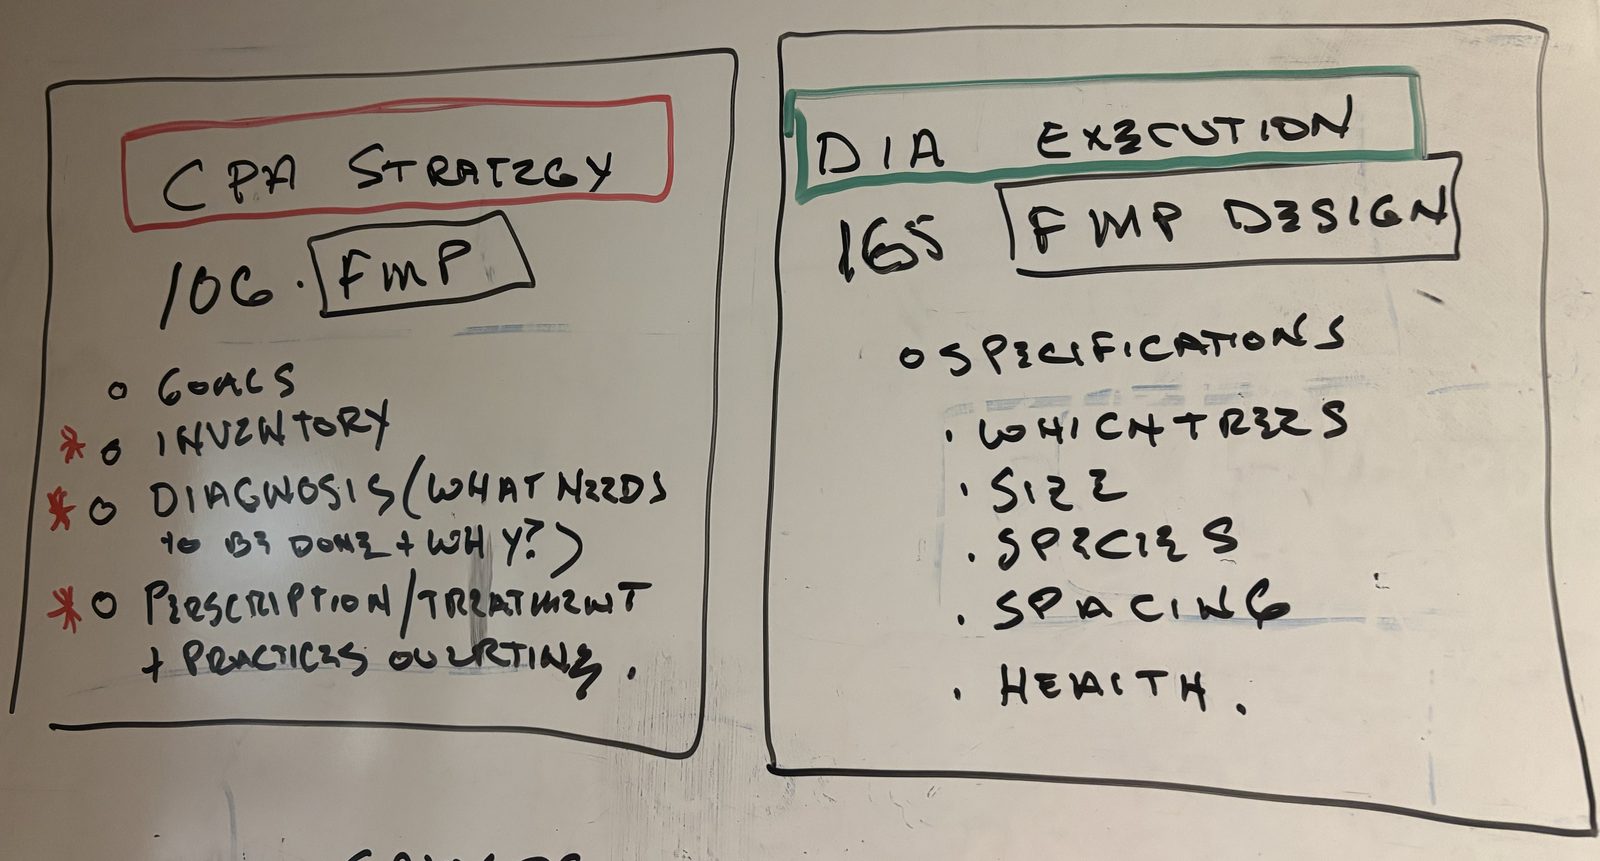
Foresters write Forest Management Plans through NRCS in two parts. The CPA 106 plan sets the strategy: goals, inventory, diagnosis and prescription. The DIA 165 design turns it into specifications: which trees, size, species, spacing and health. FMP writing is the step Earth Steward's Submit hands off to.
To learn the process firsthand, I found a point of contact at NRCS and started Technical Service Provider certification. With a forester as my sponsor, I'm working through Colorado's USDA/NRCS requirements and will submit two FMPs. Once certified, I may write plans around Hartsel, drawing on what I know of its habitat and practices, and connect my own parcel with surrounding parcels to test the crowdsourcing and network-externality idea of stitching land together.
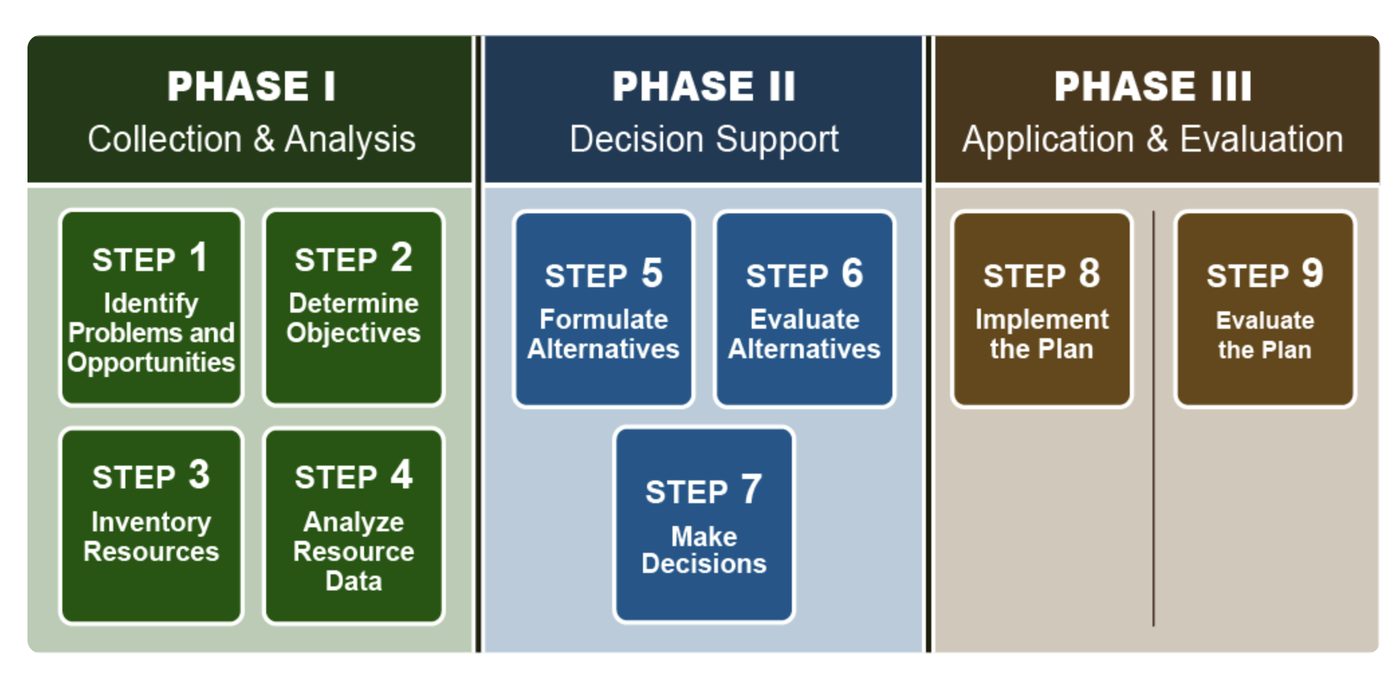
V1's feedback shaped the direction for V2. A landowner can start the process (Locate and Impact), but soon after, a forester or TSP needs to step in to approve it, guide the inventory and documentation, and walk the plan through NRCS's Nine Steps of Conservation Planning.
That's why I'm pursuing TSP certification. Unless I understand this process fully, I can't assume the app will work. Somewhere in that training I may see a solution that connects field operations with government and conservation initiatives.
NRCS criteria (October 2024): CPA 106, Forest Management Plan (PDF) and DIA 165, Forest Management Practice Design (PDF).
Habitat zone classification
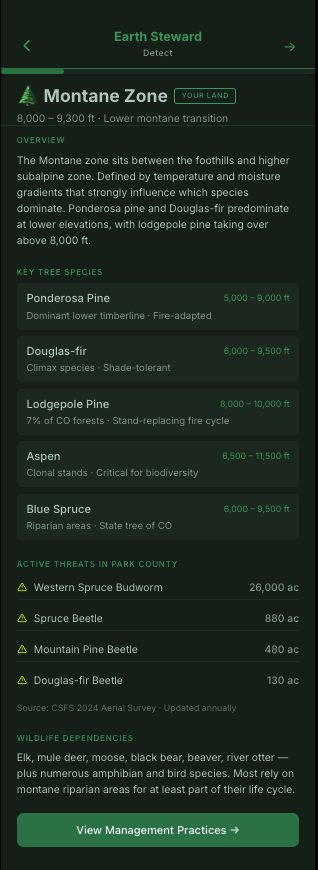
Earth Steward takes the parcel boundary from Park County assessor data and overlays it on a USGS elevation model to get the parcel's elevation range. Elevation, aspect, slope and precipitation are matched to CNHP's six habitat categories with a Random Forest model trained on that labeled zone data. The result assigns a habitat zone with its typical species, threats and practices. working
The desktop parcel map was the first proof of concept, before the mobile app. The zone was classified as Montane, and the tree species at that elevation were called out: ponderosa pine, Douglas-fir, lodgepole pine, aspen and blue spruce. That carried through to the landowner's parcel page in the React prototype.
Published life-zone ranges disagree, so the source is named: the Colorado Virtual Library and CSU's Colorado Natural Heritage Program.
Map 3: desktop parcel map, the first proof of concept
GIS and SAM 3
GIS brings together Park County parcel polygons and adjacent boundaries, elevation, NAIP aerial imagery, Gaia GPS tracks and boundaries, and the CSFS aerial survey. Meta SAM 3 segments the canopy from aerial or drone imagery and, on the ground, finds damage in photos from a text prompt. Paired with a model trained in Roboflow, it would detect anomalies, identify species and flag crown infestations. concept
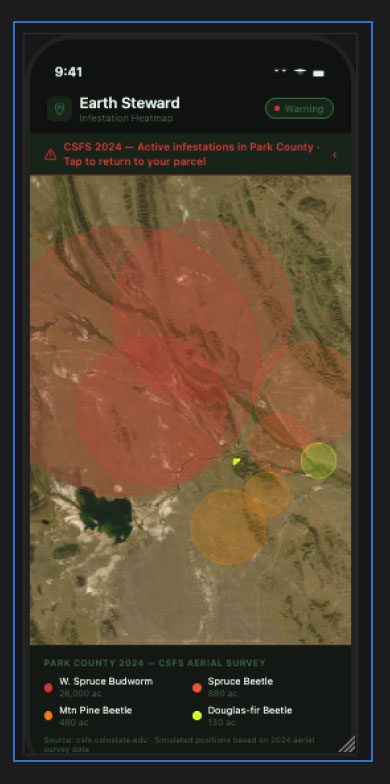
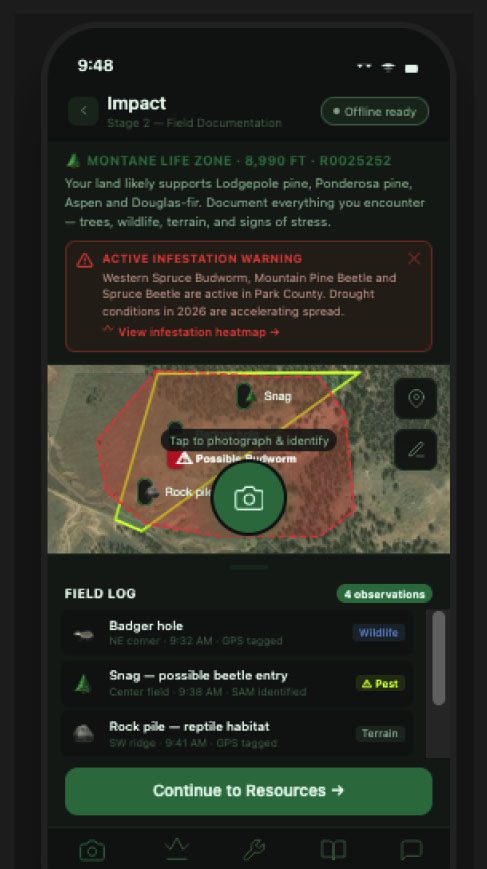
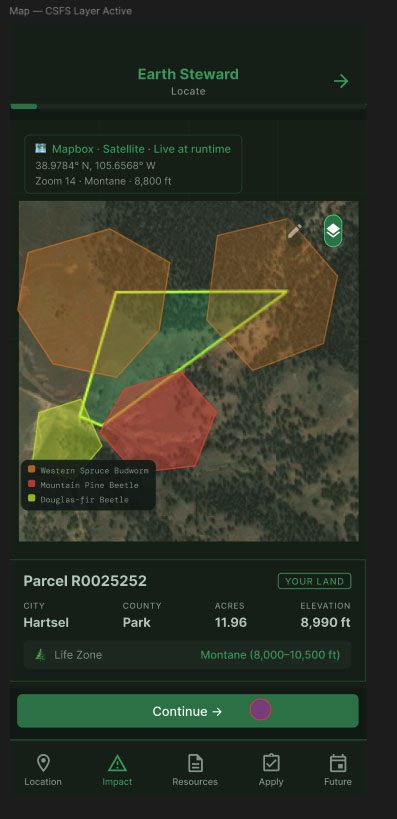
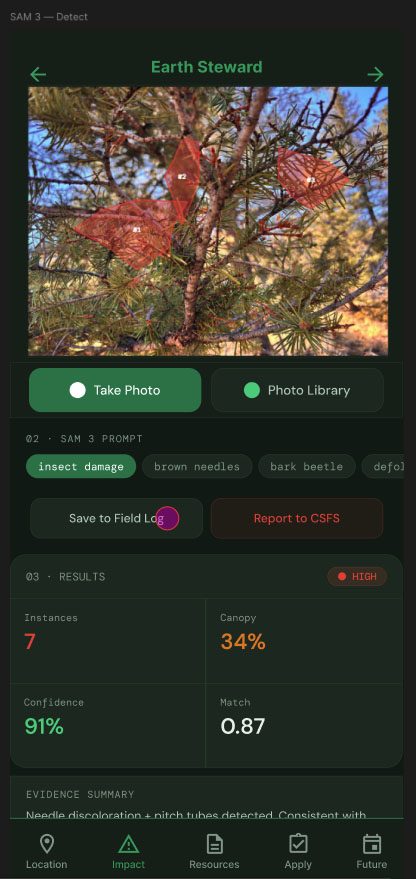
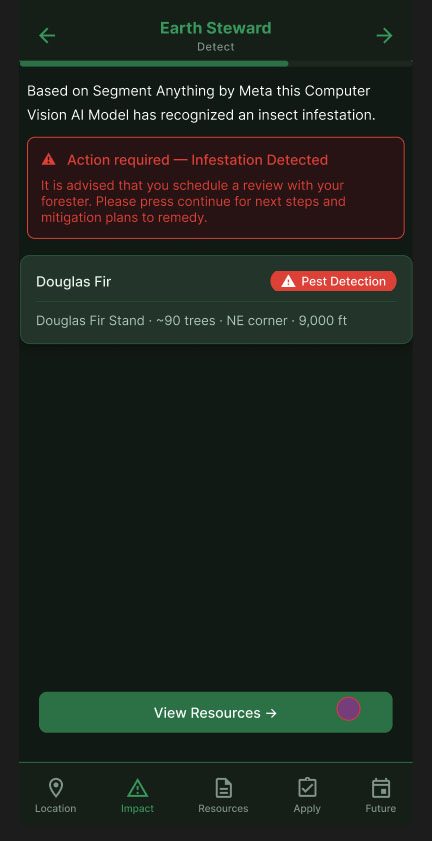
See the parcel viewer and Gaia GPS maps in Maps and documents.
Drones and LiDAR
No single source is fully accurate, so data fusion is the core job. In the MIT driveway study, I designed an access road for the parcel from a survey plat, a route drawn in Gaia GPS, geotagged photos and county elevation data. Every source disagreed with the others somewhere, so the real work was reconciling imperfect inputs into one terrain model good enough for engineering decisions.
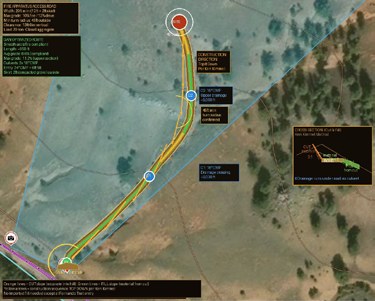
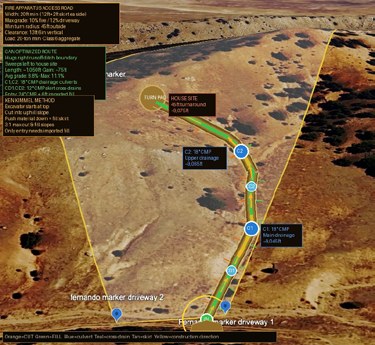
Professional platforms already do this at scale. Caterpillar and Trimble turn terrain data into buildable designs, but they're built for contractors and large projects, not a landowner with 12 acres and a phone.
LiDAR sees through the canopy to bare earth, which a driveway needs, and it measures the canopy itself, which a forester and a fuels model need. Drone imagery adds detail and timing that aerial surveys can't match. The same capture that plans a road can inventory a forest.
Gaia AI, an MIT spinout, pairs a backpack LiDAR with a mobile app. Foresters walk a cruise path while it measures height, diameter, live crown, species and density and builds a 3D point cloud. It fuses satellite, drone, below-canopy LiDAR, computer vision and forester input, the same thesis as Earth Steward. (Gaia AI is unrelated to Gaia GPS.)
Sensing layers
- SatelliteSees everything, late.
- DroneSees the canopy.
- Backpack LiDARSees under it.
- Phone photoSees one tree, right now.
Each layer is more precise and less scalable than the one above it. Earth Steward fuses them, starting with the layer every landowner already carries, and hands off to a forester who can bring a drone or backpack for the inventory an FMP needs.
Caterpillar shows where this is heading at industrial scale: autonomous machines working from a constantly updated, 360-degree view built from LiDAR, radar, GPS and cameras, with people validating the decisions. Its CES 2026 keynote lays out that vision. Earth Steward applies the same principles, fusion, digital twins and a human in the loop, to a landowner with 12 acres.
What this research is really about
Backpack LiDAR, Caterpillar's autonomous jobsites and the GAN driveway study all point the same way: tools once reserved for large projects can now help a private landowner plan with real awareness of terrain. Researching them is how I find out what's affordable and what's within reach. That matters because funding for landowners and for state and federal conservation programs has been cut, so the right tool can be the difference between a plan that happens and one that doesn't. Many landowners also don't know what's already available to them. Cheaper drones keep arriving, government data is public, and processing power is more available than it has ever been. As funding shifts, stewardship may lean more on private and nonprofit partners like the National Forest Foundation and The Nature Conservancy, and on tech firms built around sustainable practice. Earth Steward is designed to work whichever way that goes: matching each landowner to the most affordable source that answers their question.
Data capture options
In the Locate step, the landowner picks a source. These run roughly from free and broad to costly and precise. Earth Steward starts each landowner on the cheapest rung that answers their question and climbs only when the plan or funding needs more precision.
| Option | Source | Who captures it | What it gives |
|---|---|---|---|
| A1 | Assessor map, survey plat | County, surveyor | Boundary, acreage |
| A2 | NAIP aerial, satellite imagery | Public | Canopy, change over time |
| A3 | CSFS/USFS aerial detection survey | Public | Mapped infestation, but late |
| A4 | Public LiDAR (USGS 3DEP, where it exists) | Public | Bare earth, canopy height |
| A5 | CPW wildlife ranges, State Wildlife Areas | Public | How the parcel connects to wildlife and public land |
| B1 | Landowner's own drone | Landowner | Fresh canopy imagery |
| B2 | Hired drone, multispectral or LiDAR | Pilot or service | Stress indices, 3D canopy |
| C1 | Phone photos with SAM 3 Detect | Landowner | One tree, right now |
| C2 | Phone LiDAR (iPhone Pro) | Landowner | Close-range trunk and terrain scans |
| C3 | Backpack LiDAR (Gaia AI) | Forester | Full under-canopy inventory |
| C4 | Forester's cruise (prism, BAF, tape) | Forester | The verified inventory an FMP needs |
| D | Neighbors, crowdsourced reports, Gaia GPS tracks and photos | Community | Coverage across parcel lines |
| E | Full-service professional capture | Company with a forester | Planned, analyzed inventory, ready to export |
A source picker, not a fork
Every option shows what it costs, how fresh it is and how confident the result will be. Earth Steward recommends the next rung instead of making the landowner guess.
Every data point carries its source and date
When the aerial survey and the forester disagree, the app shows both and weights the fresher, closer one.
Neighbors are the network externality
Neighbors' captures fill in each other's gaps, which is how small parcels add up to a fundable project.
Professional capture is a partner
Earth Steward can be the landowner-facing front end that sends a group of neighboring parcels to a professional service when the combined project justifies it.
Data sources
| Source | What it contributes |
|---|---|
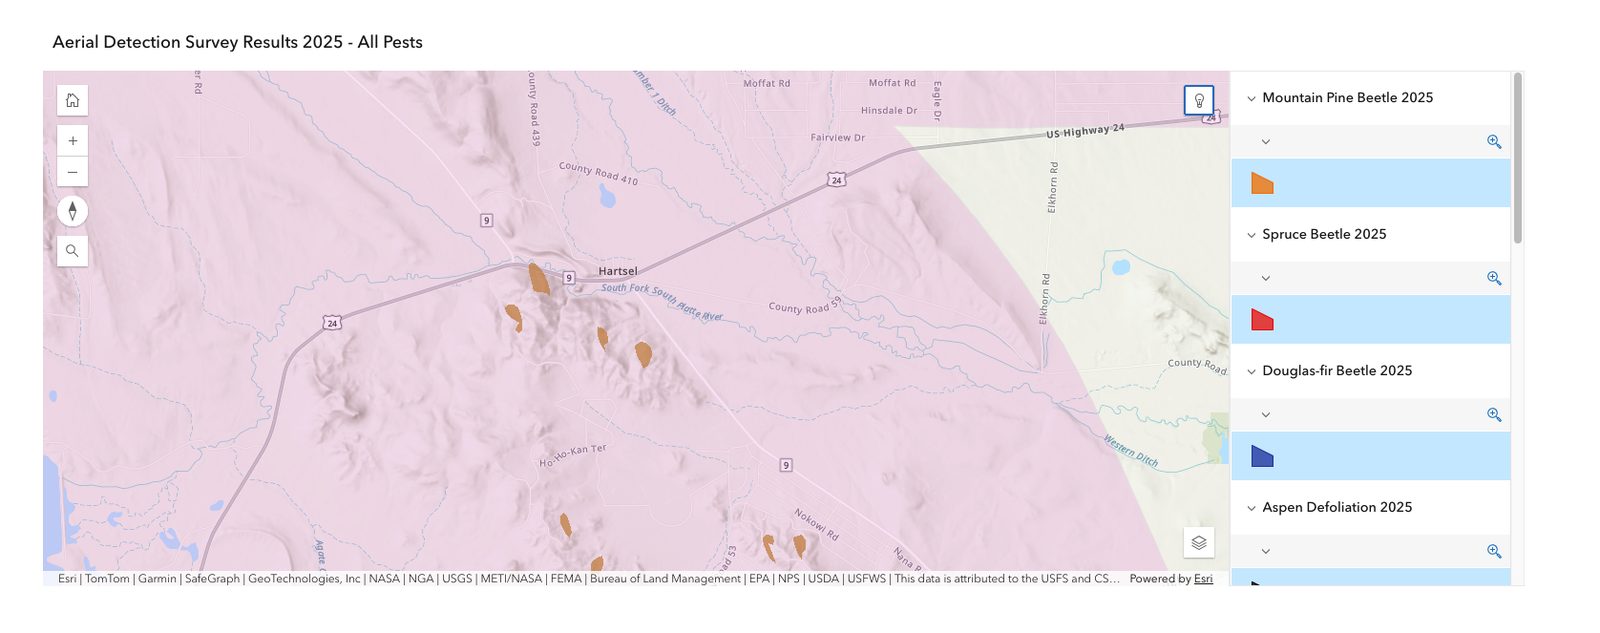
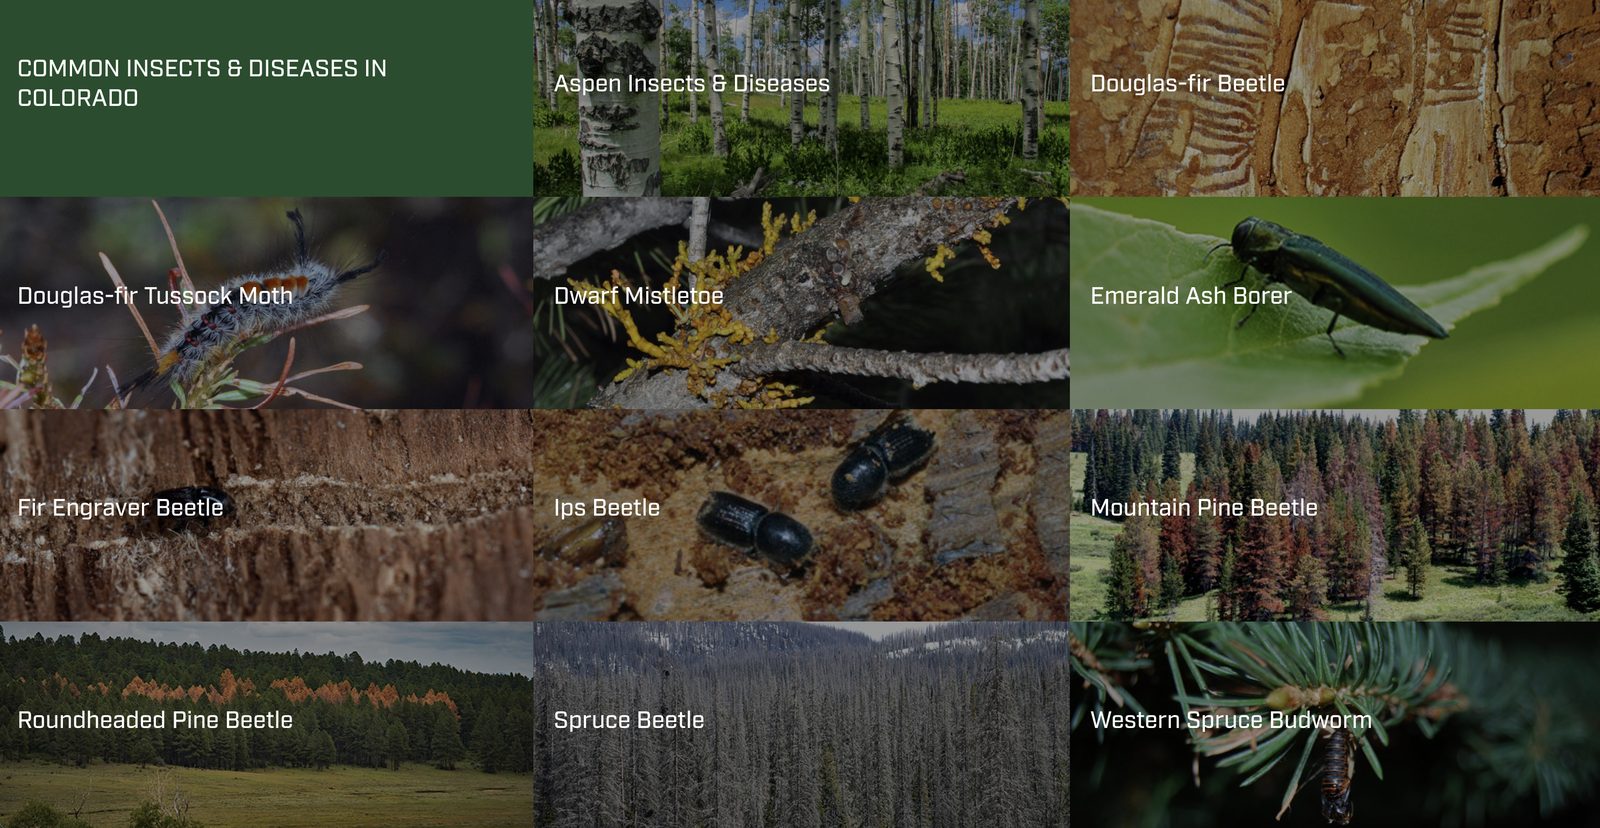
| CSFS / USFS | Aerial Detection Survey 2025 on ArcGIS, insects and diseases guide, 2024 Park County infestation acreage |
| BLM, USFS, MVUM | Public land, motor vehicle use maps and OHV routes, viewed through Gaia GPS |
| USDA / NRCS | FMP formats (106 CPA, 165 DIA), EQIP and TSP certification |
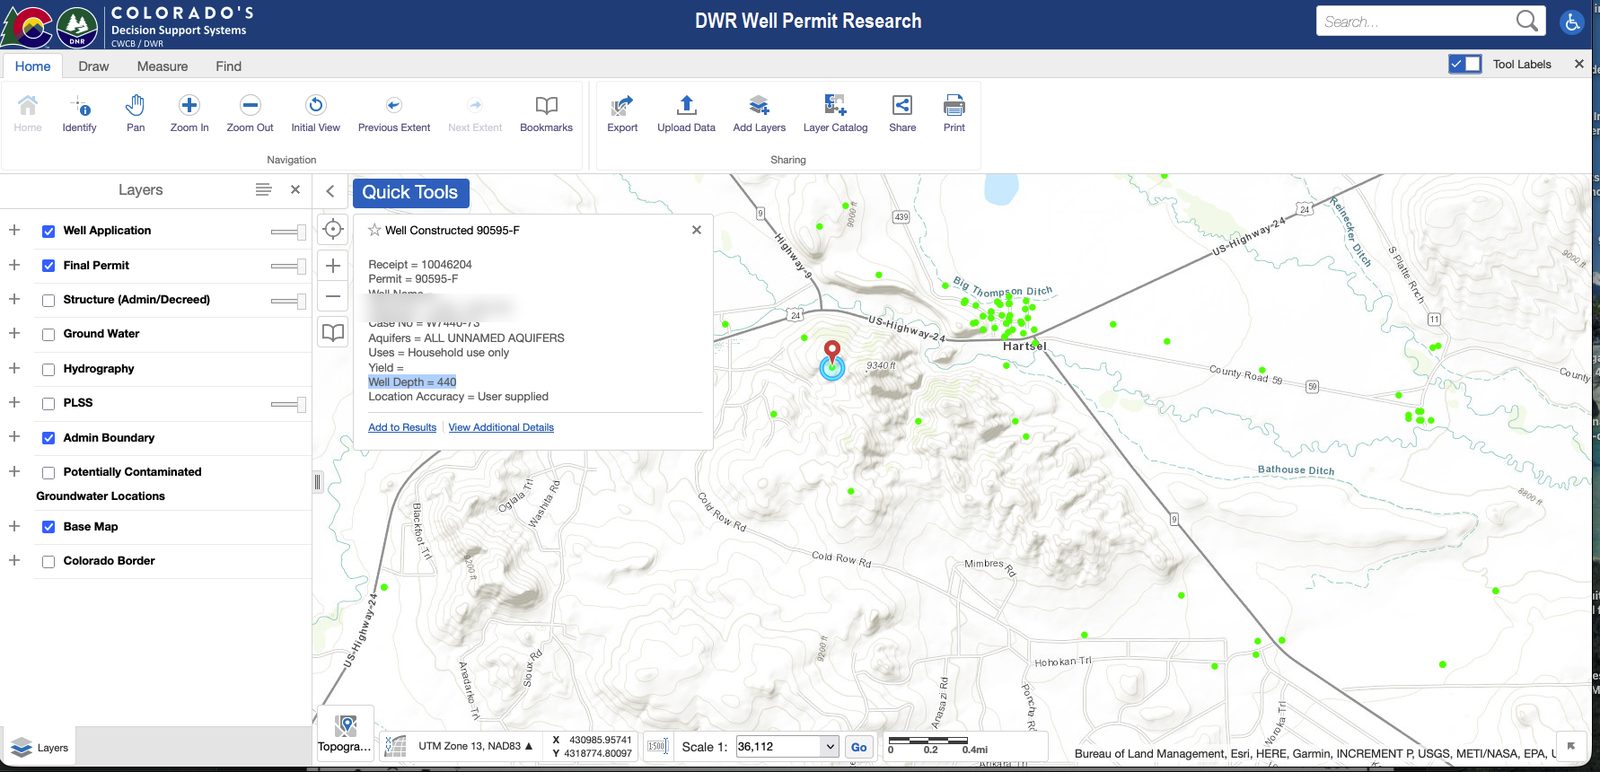
| Colorado DWR | Well permits on ArcGIS |
| Park County | qPublic parcel viewer and parcel data: polygons, adjacent boundaries, elevation |
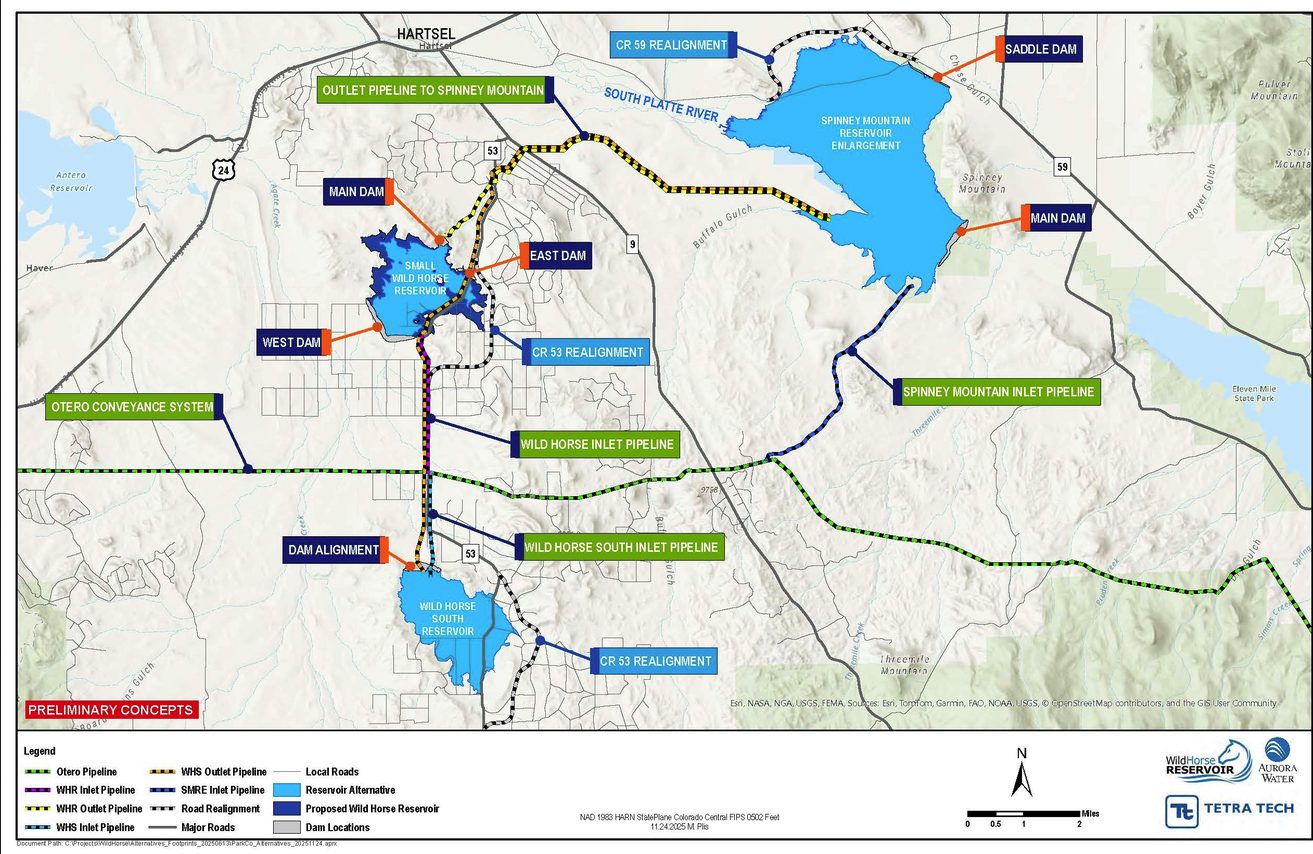
| Aurora Water / Tetra Tech | Wild Horse Reservoir concept mapping |
| CSU | Colorado Natural Heritage Program habitat zones; CO-WRAP fire risk |
| Colorado Parks and Wildlife | Wildlife range layers (pronghorn, mule deer, elk), State Wildlife Areas and GMUs; private-land habitat programs as a funding path |
See Map 4 (CSFS), Map 7 (DWR) and Map 11 (Wild Horse Reservoir) in Maps and documents.
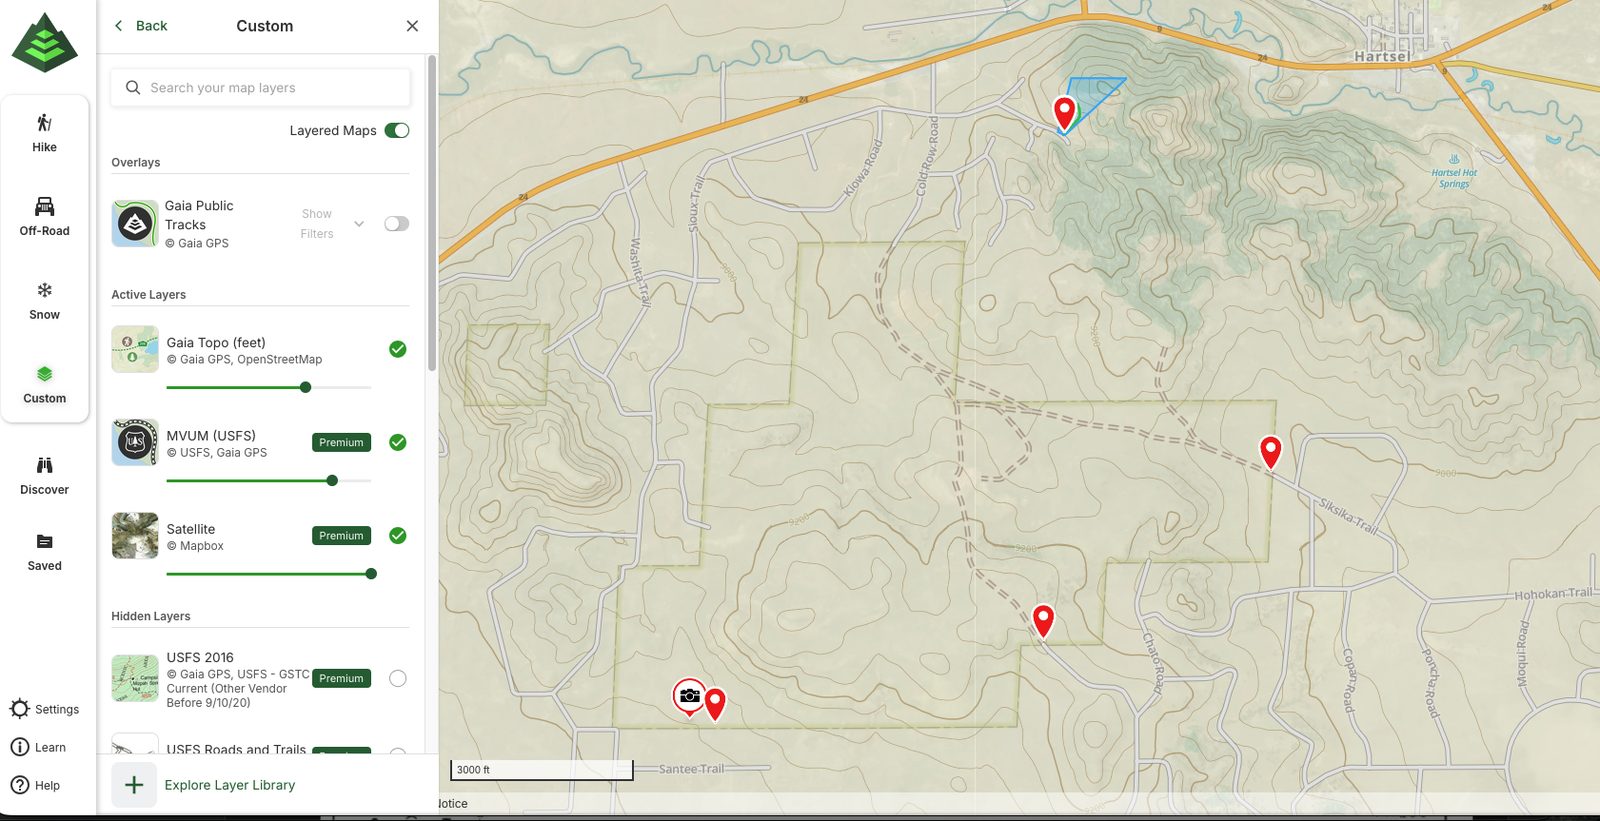
Gaia GPS and onX
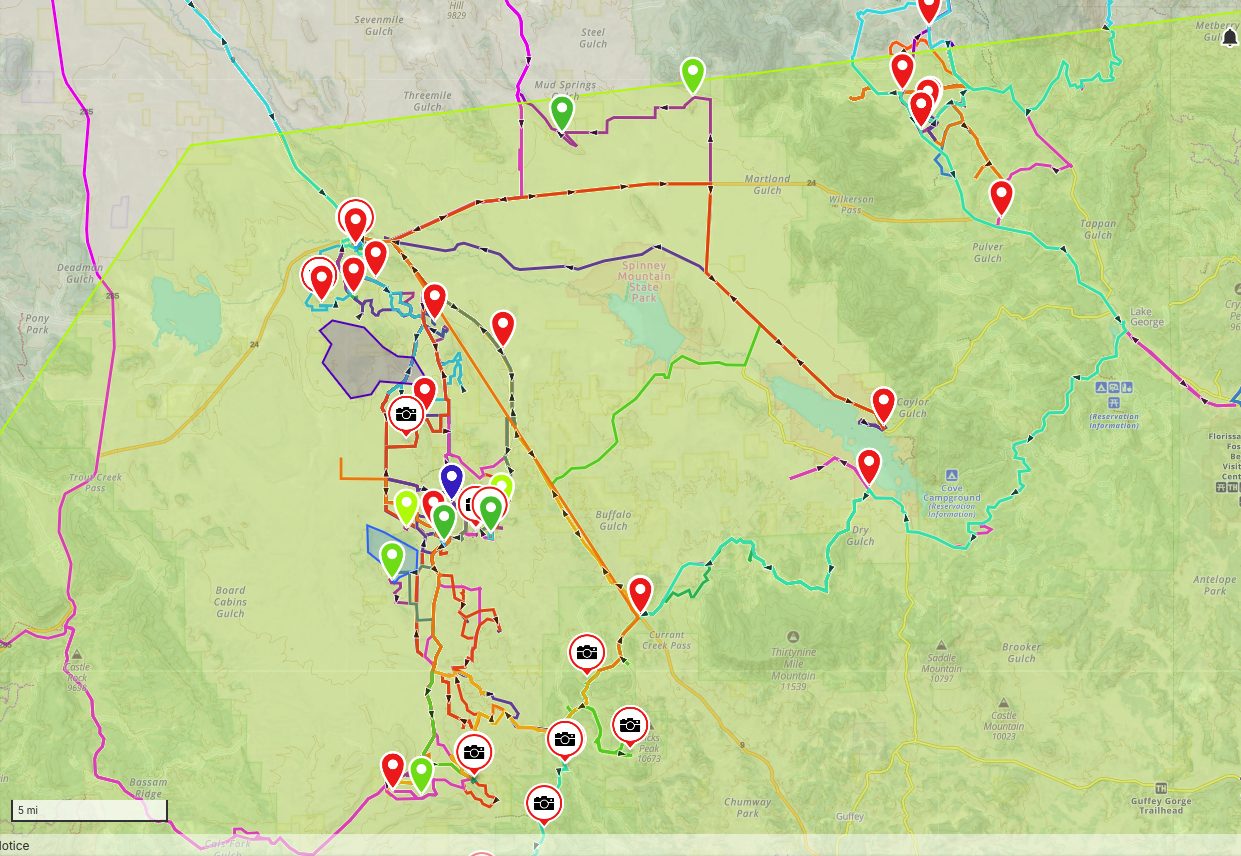
Gaia GPS has proven the most useful in my own fieldwork. I pay for it and use it for tracks, areas, points of interest, user-generated content, parcels, and MVUM, OHV, USFS and satellite layers, with tracks going back to 2023. onX likely offers more for private-land ownership, which is its core. I chose Gaia GPS originally for NOAA nautical charts for boating in Virginia; when NOAA retired that chart service in 2022, Gaia GPS swapped in a less detailed version. That's a real-world example of the data-reliability problem Earth Steward addresses.
See Maps 8–10 in Maps and documents.
Forest fuels
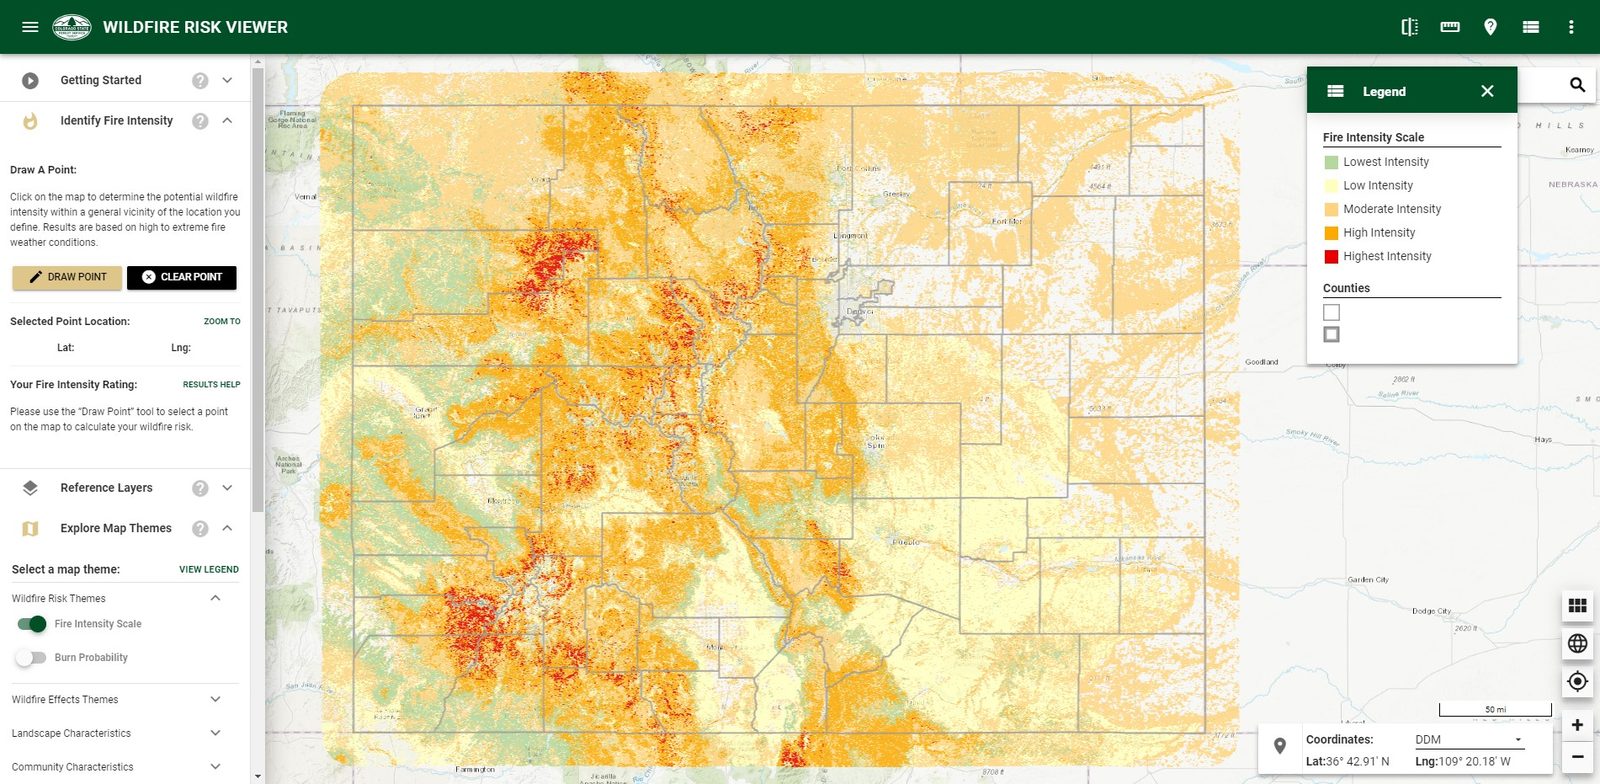
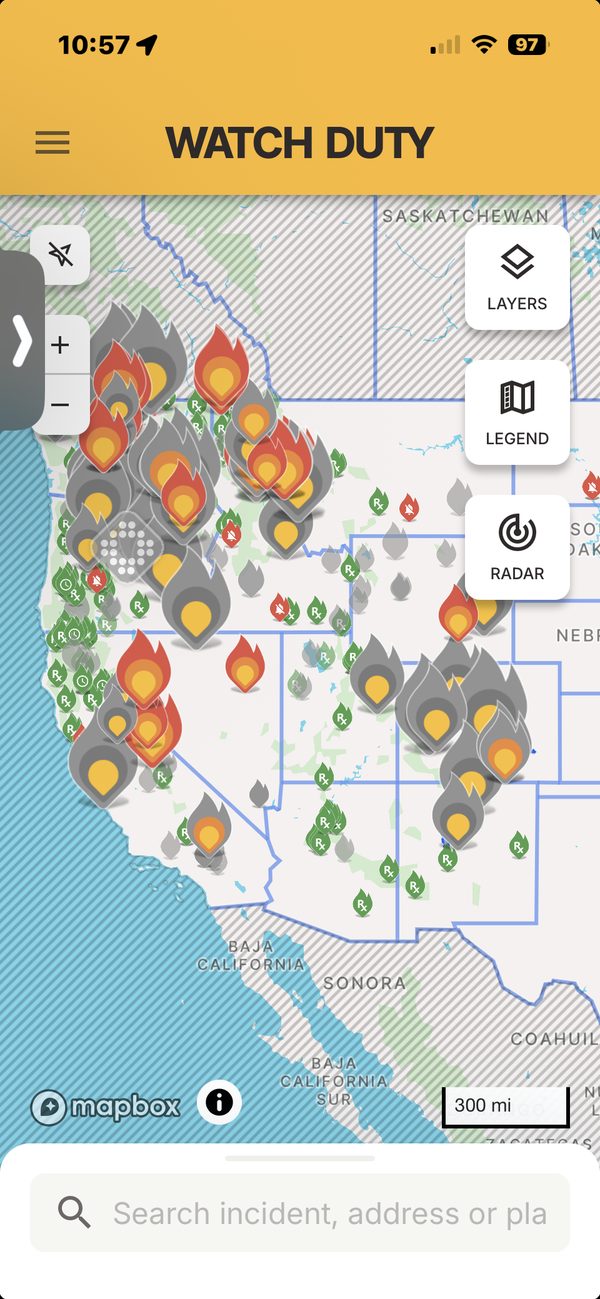
CO-WRAP (Colorado Wildfire Risk Assessment Portal) is the statewide layer for long-term risk. Watch Duty maps active fires and prescribed burns in real time and is a strong mapping and UX reference. The science behind fuels comes through a watershed scientist who spent about eight years at the USFS Missoula Fire Sciences Lab. His point for Earth Steward: fuel loading has signatures that link to satellite and raster imagery, which is what makes an AI fuels layer possible.
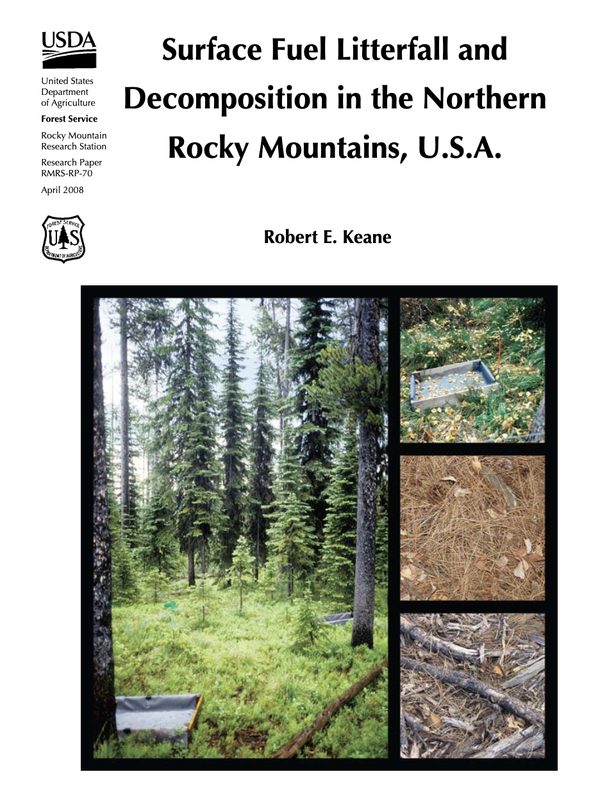
Keane 2008, RMRS-RP-70
More than ten years of litter-trap data on how fast surface fuels build up and break down, covering the same species as the pilot's montane zone. Northern Rockies data, not Colorado. PDF
FIREMON
The Fire Lab's standardized plot-level inventory and monitoring methods, combining field sampling with satellite imagery. A model for Earth Steward's ground inventory step. Link
Maps and documents
Each piece shows my own use, study and research, on the ground and geospatially. Neighbors are labeled by direction and acreage, never by name.
Parcel viewer
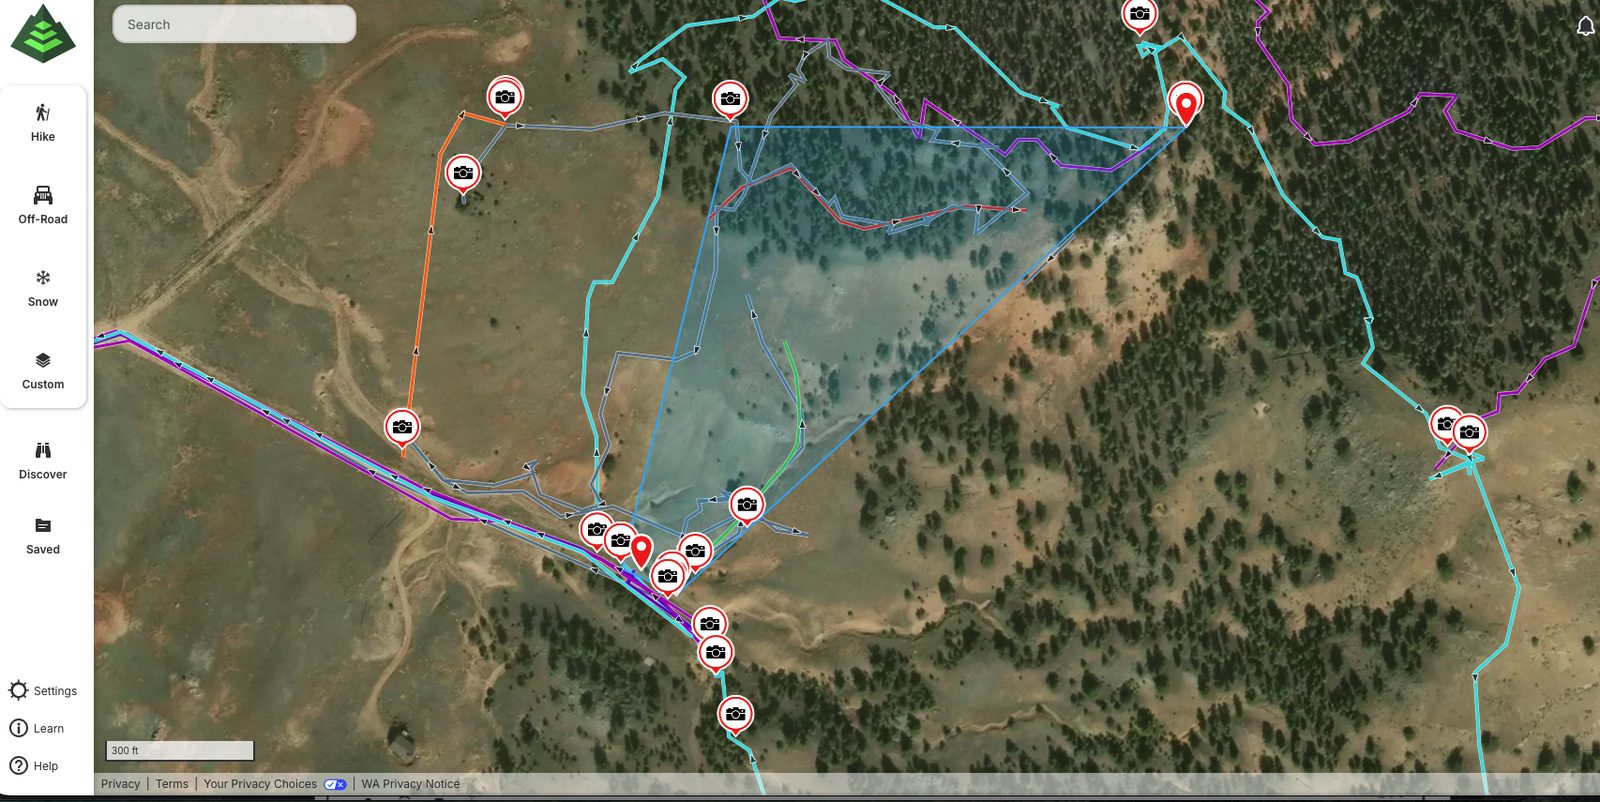
Live: Park County parcel and contour data for the pilot parcel and its ten neighbors, on Esri World Imagery. Contours every 20 ft, 8,880–9,340 ft. Owner names and addresses removed; neighbors shown by direction and acreage. This stands in for the survey plats.
Map 4: CSFS Aerial Detection Survey 2025
Build
The first build run through the full Mixed Methods cycle: storyboard, design library, Figma prototypes and a truly mobile React app.
Coming weeks
V2 is built in order, each step feeding the next. Status updates as the work moves.
| Step | What happens | Status |
|---|---|---|
| 1. Storyboard | Turning Flow V2 into sketches and mockups, building a low-fi prototype. | sketched |
| 2. Design library | Reworking the Shadcn UI Design System 2025 library so the components match what V2 needs. | published |
| 3. Figma prototypes | New prototypes built from the storyboard and the reworked library. | in progress |
| 4. React mobile app | A new React prototype that is truly mobile, built from the Figma screens. | planned |
| 5. Test and iterate | Testing on iPhone and looping back into the prototypes and the app. | planned |
| 6. Document and deliver | Updating this case study, the roadmap and the brief with what was built and what testing showed. | planned |
1. Storyboard
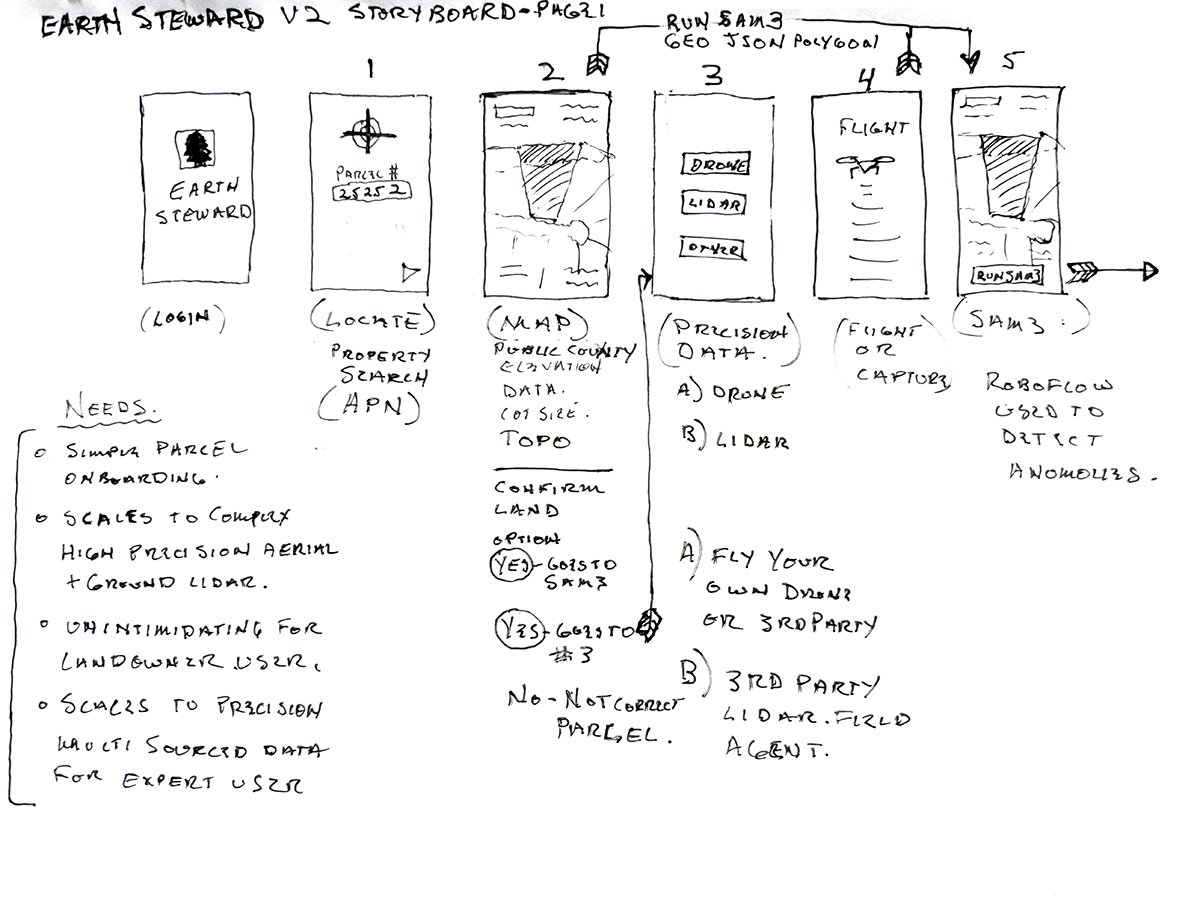
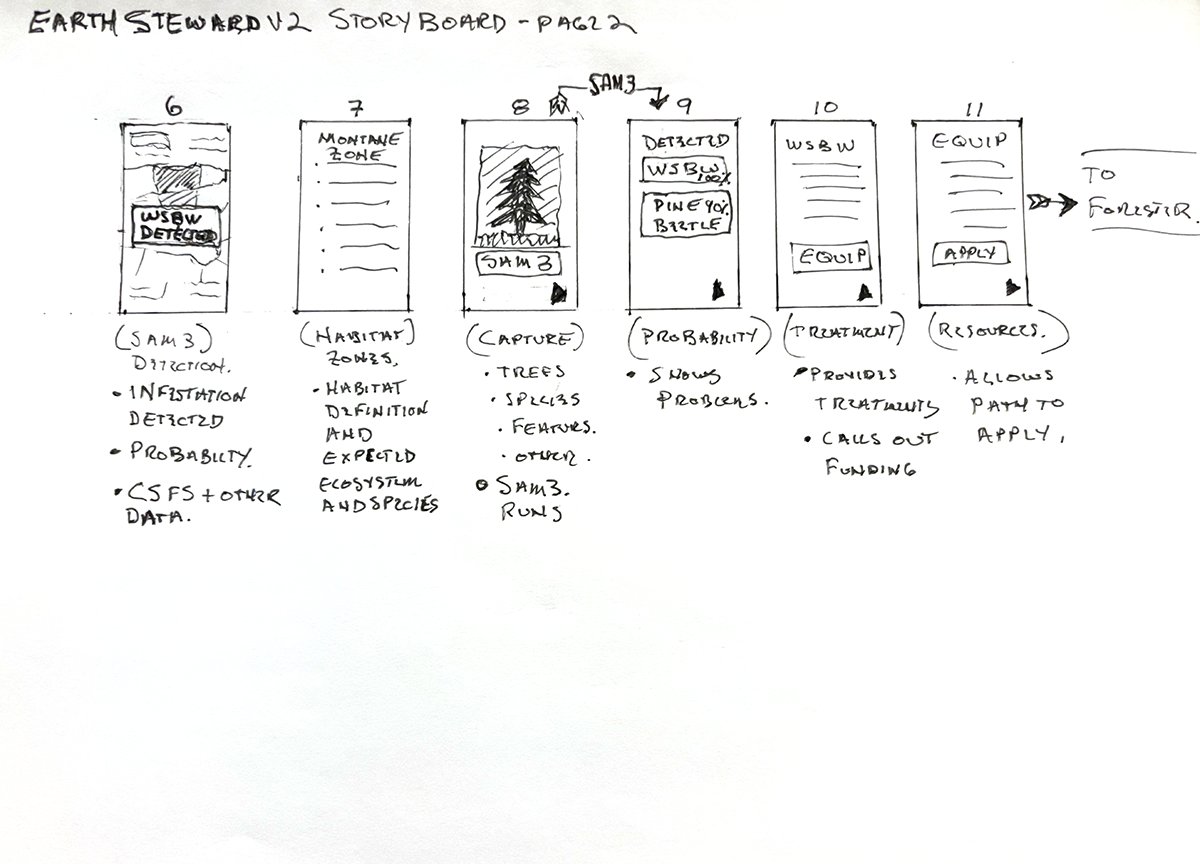
The storyboard turns Flow V2 into screens. It's a first walkthrough by hand, meant to find the shape of the experience rather than solve every case. Two pages cover the landowner's side of the flow, from opening the app to handing off to a forester.
Needs
Written on the first page, these four needs frame every screen:
- Simple parcel onboarding.
- Scales to complex, high-precision aerial and ground LiDAR.
- Unintimidating for the landowner user.
- Scales to precision, multi-sourced data for the expert user.
Page 1: onboarding and data
The landowner logs in and finds the parcel by its number. A map shows what public county data already knows: elevation, lot size and topography. Then comes the key choice. The landowner can confirm the parcel and run SAM 3 on that data right away, add more precise data first (a drone flight, LiDAR, or something else), or say it's the wrong parcel. The precise path continues to a flight or capture, and then to SAM 3 with a Roboflow-trained model looking for anomalies.
Page 2: detection to funding
SAM 3 flags a possible infestation, with its likelihood and CSFS data behind it. The Montane habitat zone explains what should be growing there. Ground photos add trees, species and features, with SAM 3 running on each. A probability screen shows what was found, a treatment screen suggests what to do and calls out funding, and a resources screen opens the path to apply for EQIP. Then the work goes to a forester.
That fork on the first page is the design answer to the Needs: a landowner can stop at free public data and still get a result, and an expert can add a drone or LiDAR when the plan or the funding needs more precision.
Where the forester comes in
In the sketches, the forester arrives at the end. V1 feedback says that's too late: foresters need to approve, guide the inventory and walk the plan through NRCS's planning steps. So the next pass moves the forester earlier. Three options are on the table:
- At the data-source choice. Foresters may have better access to drone and LiDAR operators, so the human is in the loop from the start.
- Near submission, for a trusted landowner. Some foresters may trust a landowner to run SAM 3 and document the habitat, parcel and inventory, then review and sign off near the end.
- After detection. The landowner locates, detects and captures alone, then shares the findings. Treatment and funding come from the forester's plan, not straight from the app.
The first two may be one flow at two trust levels: the app adapts to the relationship a landowner already has with a forester, instead of forcing one path.
2. Design library
V2 starts from a copy of the V1 library, so V1 stays intact as the record of the first build. The first pass was cleanup:
- Tokens. About 300 hard-coded colors in the Earth Steward components now use named color tokens, with web names ready for the React build. A few new tokens cover what the components need.
- Dark theme. Every component and variant is set to the Earth Steward dark theme, so it looks right wherever it's placed.
- Duplicates. Copies in the atomic design map became live instances, so a change in one place updates everywhere.
- Collapsed parts. Alerts and inputs that had collapsed are fixed.
- Names. Unclear components were renamed.
- Montane range. Standardized at 8,000–9,300 ft.
The library also has a new iPhone screen template (393 × 852) that every V2 screen starts from.
Then each storyboard screen was checked against the library to see what can be reused from V1 and what's new.
| Screen | Reuse from V1 | New or changed |
|---|---|---|
| 1. Locate | Input, button | Parcel search: one field for parcel number or address, with a results list to confirm |
| 2. Map | Map, parcel info bar, bottom sheet | Confirm sheet with three choices: analyze now, add precision data, wrong parcel |
| 3. Precision data | None | Source option card: drone, LiDAR, or other (existing public LiDAR, an uploaded survey or point cloud) |
| 4. Flight or capture | Flow progress | Capture status: scheduled, capturing, complete, failed |
| 5. SAM 3 | Map, SAM 3 run button, prompt chips | A source and date stamp showing which data the run uses |
| 6. Detection | Warning alert, detection card | Full-width banner alert |
| 7. Habitat zone | Montane Zone screen, tree cards | The zone sheet as a reusable component |
| 8. Capture | Camera, field photos, observation card | Field log row with category tags (wildlife, pest, terrain) |
| 9. Probability | Confidence badges, alerts | Confidence levels with source and date instead of percentages; verify with a forester |
| 10. Treatment | Action card, cost-share bar | Practice codes and a status: suggested by the app, or approved by the forester |
| 11. Resources | Funding programs card, forester card | What's ready and what's missing for the EQIP application |
The source and date stamp carries a principle from Learn into the interface: every data point shows where it came from and how fresh it is. Showing a confidence level instead of a percentage, and marking whether a treatment was suggested by the app or approved by a forester, keeps the human in the loop on screen.
3. Figma prototypes
in progress The full flow is laid out in Figma as a clickable iOS prototype: twelve screens, from launch and locating a parcel by APN, through confirming the land on the map and choosing a data source (parcel data, drone or LiDAR), to SAM 3 detection, the montane zone, a ground photo, an EQIP suggestion and NRCS resources.
Screens 0–5 are new for V2, built from storyboard page 1 with the published V2 library. Screens 6–11 carry forward the strongest V1 screens and are being restyled to match. SAM 3 results are illustrative, and drone and LiDAR capture are hypotheses this prototype exists to test, not settled features.
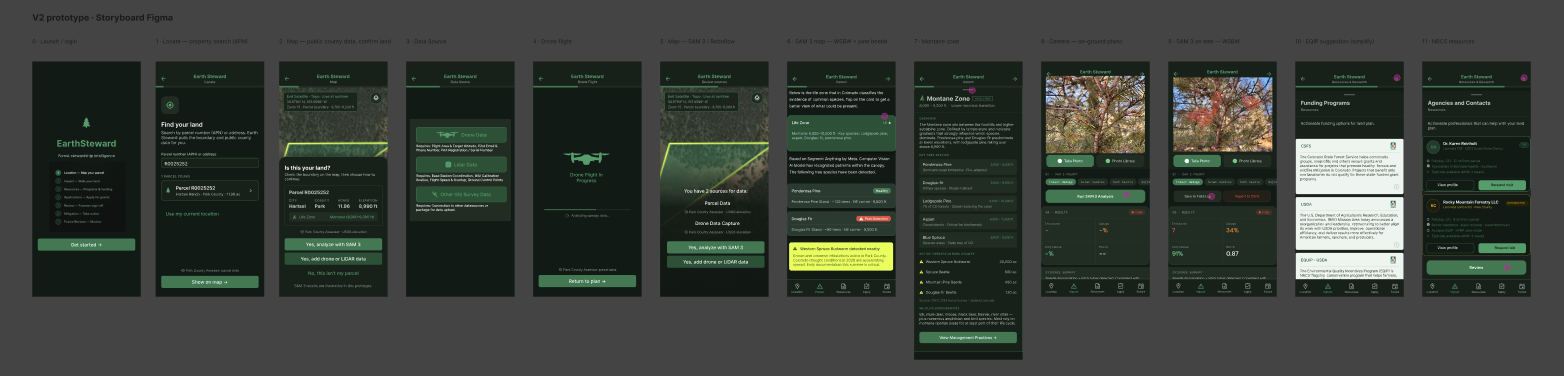
Try the clickable prototype and design library →
AI methods, data and status
| Layer | Method | Status |
|---|---|---|
| Habitat zone | Random Forest matching elevation to CNHP habitat zones | working |
| Canopy | SAM 3 segmentation on NAIP aerial imagery | feasible, untested |
| Species | DeepForest and Vision Transformers, 5 to 7 dominant species | concept, needs training data |
| Stress | NDVI/NDRE indices with Isolation Forest anomaly flags | concept |
| Fuels | CO-WRAP | feasible, public data |
| Safeguards | Confidence scores, red/yellow/green alerts, licensed forester sign-off | designed |
Roboflow training was started and is waiting on support and funding. Result numbers in the prototype screens are illustrative until a trained model produces them.
Test
Testing V2 on iPhone with landowners, foresters and TSPs, then iterating back into Build.
Plan
V2 is tested on iPhone with the people it's built for: landowners, foresters and TSPs. Survey respondents are a natural pool. Testing covers the Figma prototypes first, then the React app.
What gets measured
Whether a landowner can locate a parcel, read its habitat zone and threats, document what they see and hand it to a forester without help. Whether a forester finds the hand-off ready for an FMP. Where people hesitate or get lost.
How results loop back
Findings feed straight back into Build: the storyboard, the library, the prototypes and the app. Each round is logged here with what changed and why.
Needed Test sessions, participants and findings, once Build is ready.
Notes
- Network externalities, as taught by Professor Brian Subirana in MIT xPRO's Designing and Building AI Products and Services. Subirana is a Full Professor of Artificial Intelligence at EADA Business School and a longtime researcher and instructor associated with MIT and Harvard.
- Michael L. Katz and Carl Shapiro, "Network Externalities, Competition, and Compatibility," American Economic Review 75, no. 3 (1985): 424–440.
- Arnoldo C. Hax and Dean L. Wilde II, The Delta Project: Discovering New Sources of Profitability in a Networked Economy (Palgrave, 2001).